
How much has tuition increased at WSU over the years? In this assignment, you’ll be organizing data to show how tuition at WSU has changed since 1970. Later, in a different assignment, you’ll create a set of charts to visualize and explain the data.
Part 1: Organizing Tuition Data
1. Since you’ll need this data for later assignments, make sure you are keeping your files organized so you can easily find the correct data later on. Use folders and consistent file names. Once you start having a lot of projects and spreadsheets, staying organized is essential to avoid mistakes!
2. We’re again going to use data from the WSU Office of Institutional Research, which manages statistics the university is required to report to the federal government. The data about tuition is listed in the “Tuition Overview” section. For many years, WSU published this information as an Excel file. A few years ago it was changed to a PDF file and in 2021 it was switched to a data visualization created with Tableau.
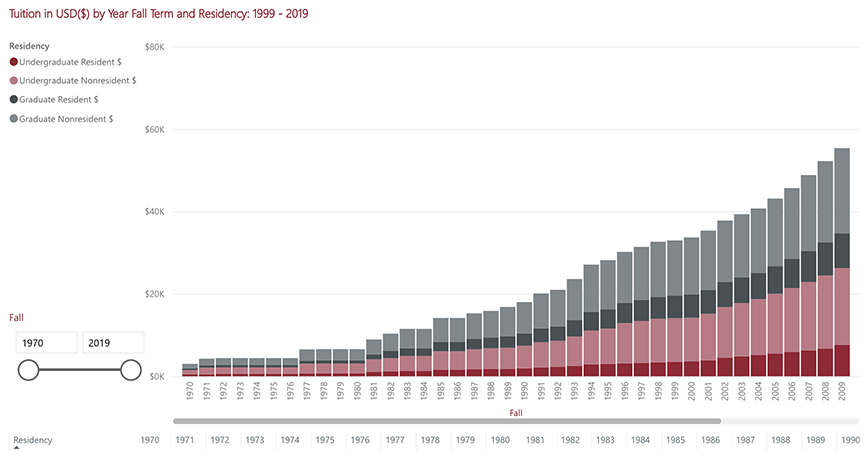
This change may not be interesting to most people, but it’s a great example for this course! Compared to the old Excel file, the new Tableau dashboard is easier for the average viewer to explore and immediately find information. But since the raw data is no longer available, it makes it harder for people to do their own analysis — for instance, we’re going to adjust for inflation. Professionals who work with data always want the raw data. There is an option in Tableau to enable data downloads, but it appears WSU has not allowed that option.
Instead, download this file previously hosted on their site, which has been updated with the most recent information available: tuition-and-fees-annually-2022update.xlsx
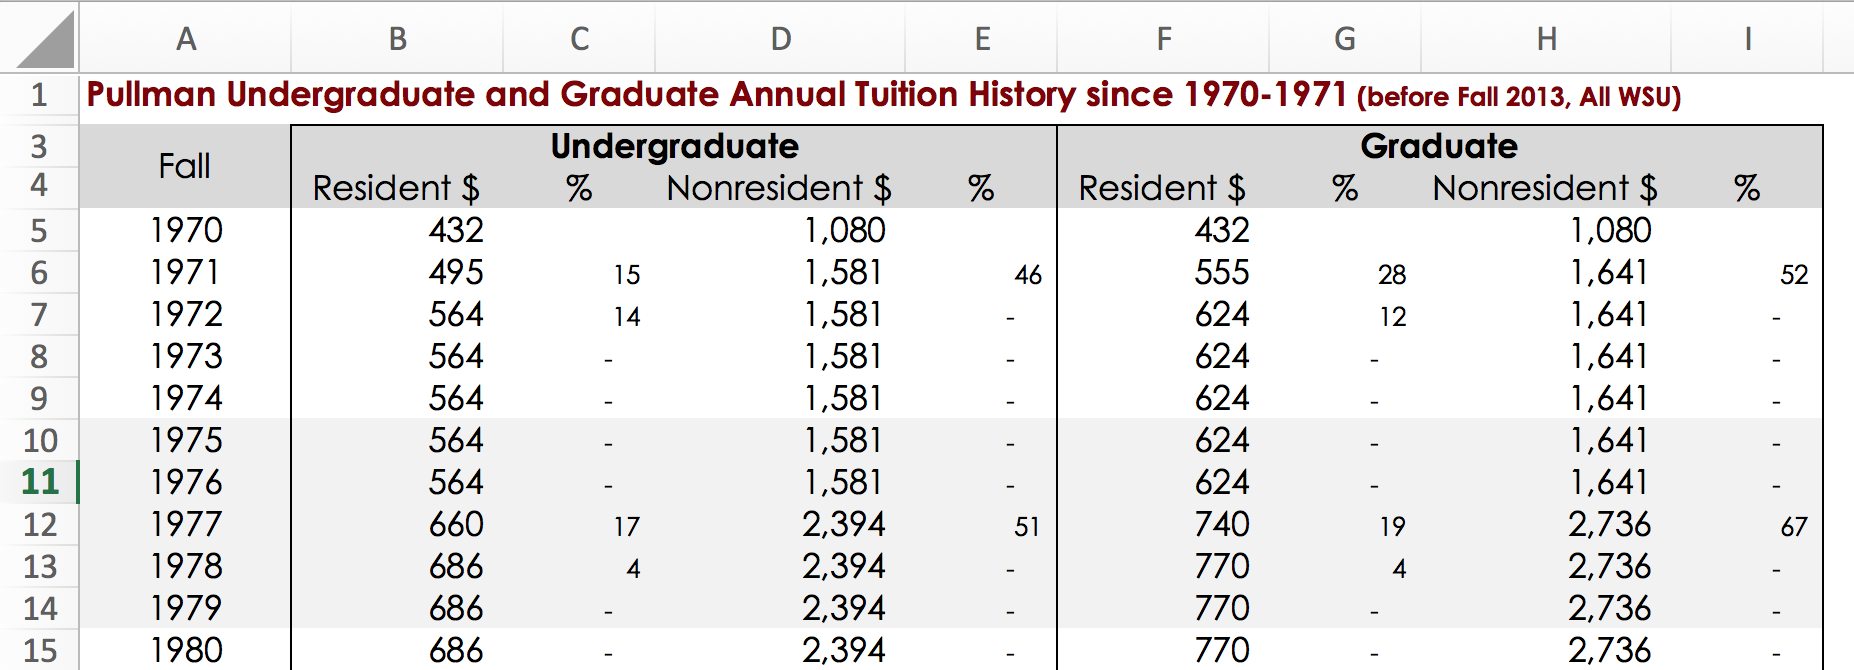
Don’t see this when you open the file? Look at the bottom and make sure you’re on the “Tuition” tab.
The tuition spreadsheet includes a column for the year and additional columns for different types of tuition. Here’s what you need to know to understand the data:
- This is annual data by academic year, so 1970 means the 1970-71 school year.
- WSU charges two different rates for undergraduate tuition. Residents of Washington state pay a lower rate, because WSU is partially funded by state taxpayers. Nonresident rates are higher because those students (or their families) have not already supported WSU through state taxes.
- Resident and in-state tuition are two terms for the same thing. Nonresident and out-of-state tuition are also synonymous terms.
- Monetary inflation means that $10 was worth more in 1970 than it is today. The spreadsheet lists exactly what a student would have paid in a given year without taking inflation into account.
You’re probably aware of inflation as a consumer concept — basically the idea that things cost more today than they used to. Whenever you look at costs over time, you have to take inflation into account. Watch this 2-minute explainer video from PBS (Part 1), both for the information and for seeing how they use visualizations.

Organize Your Data
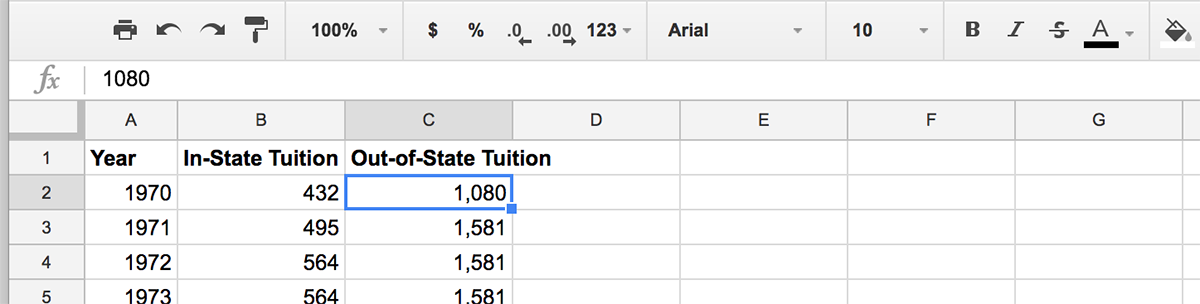
3. Open a new spreadsheet in Excel or Google Sheets, and save it with an appropriate file name. We will only be working with undergraduate tuition for this assignment. Your first column will include the year, your second column will include in-state tuition, and your third column will include out-of-state tuition.
- Make sure to label each column in the top row.
- You can copy-paste the correct data directly from the IR spreadsheet.
Percent Change
4. In the fourth column, calculate the percent change of in-state tuition for 1971 through 2022. Percent change tells us how much something has changed as a percentage of what it was before. Let’s say the cost of something increased from $5 to $10. The cost doubled, so the percent change is 100%. The change is equivalent to 100% of the original cost.
- Percent change can be negative if something decreases.
- One way to remember the formula is =(Newer – Older)/Older.
- You can also use percent change calculators online to check your work: http://www.percent-change.com
- There will be no percent change for 1970, since there is no earlier year listed to compare it to. You can leave 1970 blank.
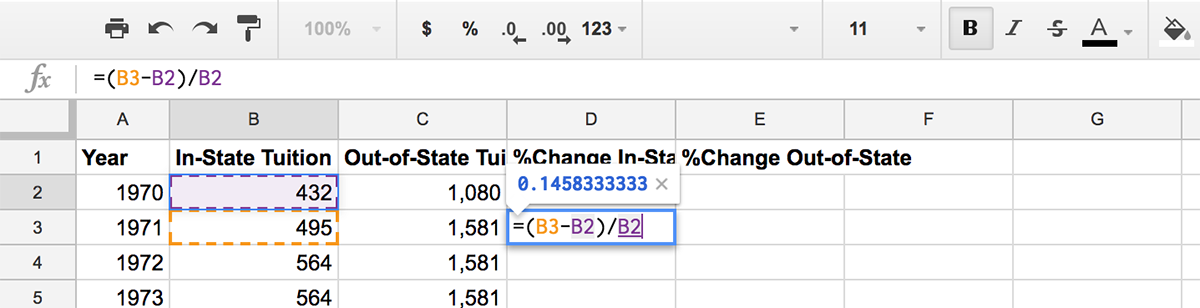
When I calculate percent change, I still say the formula aloud to myself as I type it in: “Newer minus older, divided by older.”
5. In the fifth column, repeat the process to calculate the percent change for out-of-state-tuition from 1971 to the most recent year.
Adjusting for Inflation
6. How much less did students pay in 1970? Because of inflation, it’s difficult to compare with the raw numbers. Label the sixth column for inflation-adjusted in-state tuition, and calculate what each year’s tuition would be in 2022 dollars.
Inflation can be calculated using the Bureau of Labor Statistics calculator: http://www.bls.gov/data/inflation_calculator.htm
However, it can be tedious to go through each year with the calculator. There is a more efficient way to calculate inflation by downloading Consumer Price Index data from the Bureau of Labor Statistics. (It seems trickier, but I promise it’s a lot faster!)
- Go to data.bls.gov
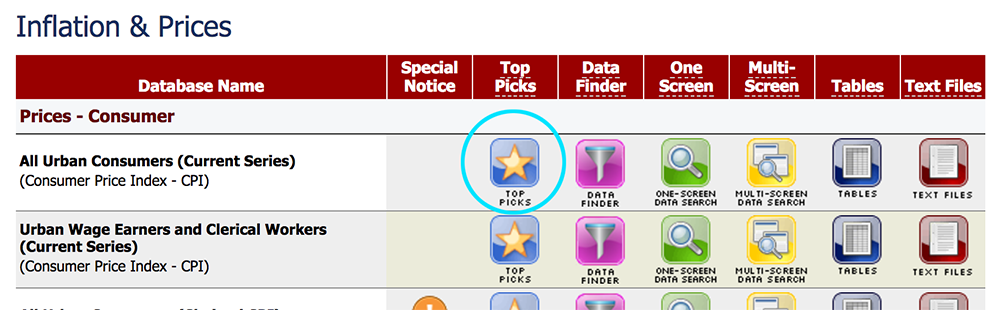
- Scroll down a bit to view the many data download options. A huge amount of data is available here, but we’re going to keep it simple by selecting the Top Picks button for All Urban Consumers (Current Series) database.
- Click the checkbox for the first series listed: U.S. All items, 1982-84=100 – CUUR0000SA0
- Click the “Retrieve Data” button at the bottom of the list
This is an old screenshot. You should select 1970 to the most recent year in the dataset.
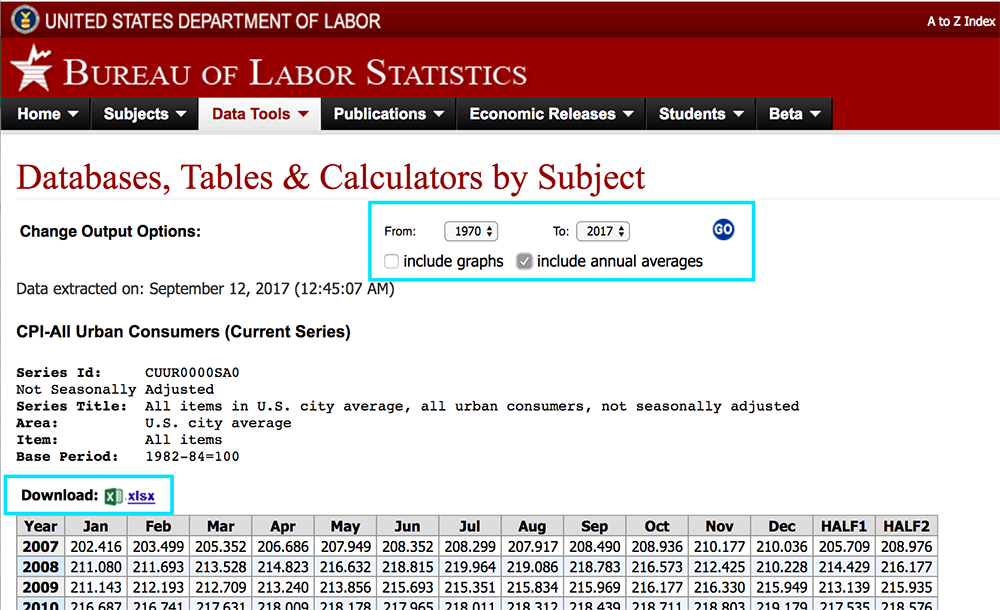
- The data will appear, with options for choosing different years. Set the range to match the data you want to calculate (in this case, 1970 to 2022) and click the checkbox to display annual averages. Click the blue “GO” button to apply these preferences.
- Once you see the data appear, download the .xls file that contains the same data.
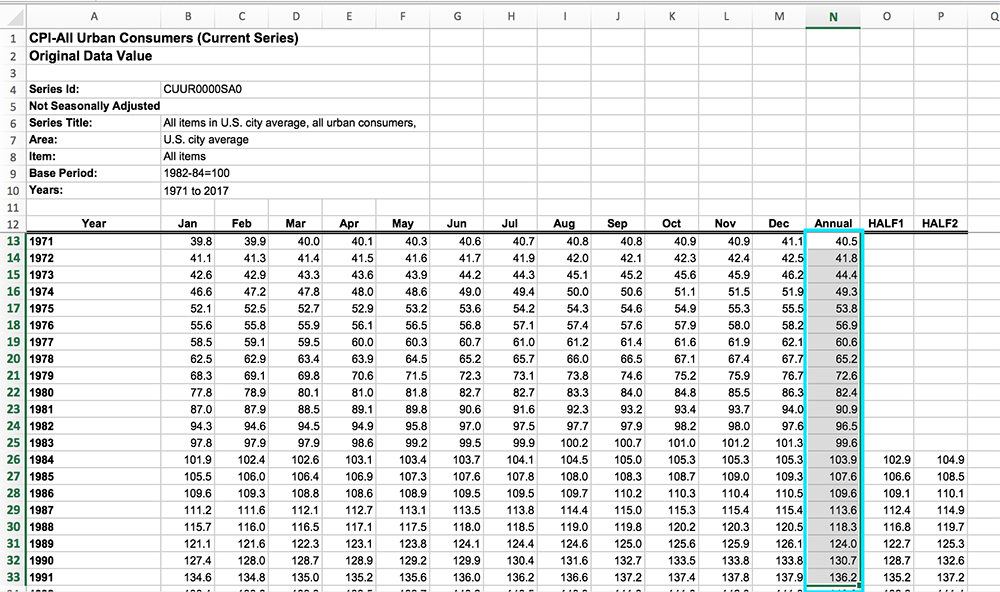
- Open the .xls file and copy the data from the “Annual” column. Paste this into a new column in the tuition spreadsheet you’ve been working on.
- Next, we need to adjust these index numbers to the year we want as our baseline. If you want the values adjusted to 2022 dollars, for example, then 2022 is our baseline. In a new column, use a percent change formula to calculate the ratio of each year’s index compared to the baseline index.
- Now that you have the ratio, you can use this as a multiplier with the real dollars for each year. In a column for inflation-adjusted values, use a formula to make this calculation.
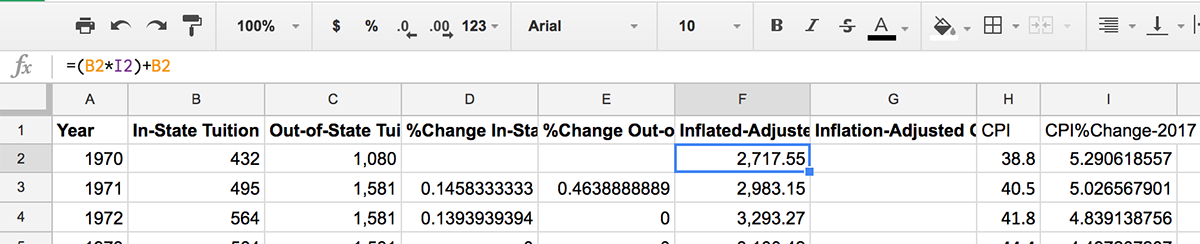
To complete the formula for the inflation-adjusted amount, the ratio and actual dollars are multiplied to calculate the difference in dollars. This must then be added to the original dollar amount for the total inflation-adjusted amount:
=(%ChangeCPI * Tuition)+Tuition
Not sure if you did it correctly? You can always use the BLS calculator to check a few years and make sure the numbers are the same. It is also fine to use the BLS calculator method for all values, but getting the formulas figured out will save a lot of time in the long run.
7. In Excel or Google Sheets, make a quick chart showing in-state undergraduate tuition costs from 1970 to 2022. Choose a chart type that you think represents the data well. This is just a rough chart to look at trends, so don’t worry about colors or getting the labels perfect.
8. Save your spreadsheet and chart in a format you can submit to Canvas later.
Thinking About Tuition Data
Answer the following questions in 1-2 sentences each, to think about the data we’ve just organized and what we might be able to do with it.
1. Suppose you want to compare WSU’s tuition rates to those of other Pac-12 institutions, so you begin to look up the rates at other universities. Here is the page with tuition rate information at the University of Colorado-Boulder. What about this data would make it difficult to compare to WSU?
2. Tuition is sometimes listed separately from mandatory fees, and sometimes combined. The mandatory fees paid by WSU students in Pullman are listed in the IR spreadsheet in the “Fee Detail” tab. (Fees vary by campus since students only pay for projects at their home campus.) What are two examples of mandatory fees? As a student, are you more interested in changes in tuition with or without mandatory fees included?
3. What is a notable recent trend in WSU tuition data, if you were writing a news story or press release? (Looking at the rough chart you created may be helpful.)
Submitting Your Work
Include the following with your Canvas submission:
- Your spreadsheet
- Your rough chart, if not included in your spreadsheet
- Your written responses to the questions