
In this assignment, you’ll make promotional infographics suitable for sharing on social media. You’ll choose a communication message and use Adobe Illustrator for Part 1, then experiment with several interactive web tools for Part 2.
If you do not have access to Adobe Illustrator, you can instead use three different web tools.
The process for this assignment is like working for a client. Your pretend client is a real advocacy initiative, Project Play, which is part of The Aspen Institute. The program is led by former sports journalists and promotes participation in youth sports in the U.S.
Part 1: Illustrator Infographics
Your task is to share key insights from Project Play reports in appealing, easy-to-understand infographics that could be shared on Instagram.
Your sources of information:
You can choose any data and facts from those sources. Assume your audience is people who are generally interested in youth sports but not experts, like coaches and families. Think about what is interesting, surprising and likely to be shared.
1. Download this template for using in Illustrator: instagram-ai-template.zip
- Fully unzip or extract the Illustrator .ai file from the zip folder.
- Open the file in Adobe Illustrator and save a version with a new file name so you know it’s your version instead of the blank template.
- If you are using an older version of Illustrator or get an error message about the file being from a newer version, download this version instead: instagram-ai-template-legacy.zip
The file should look like this:
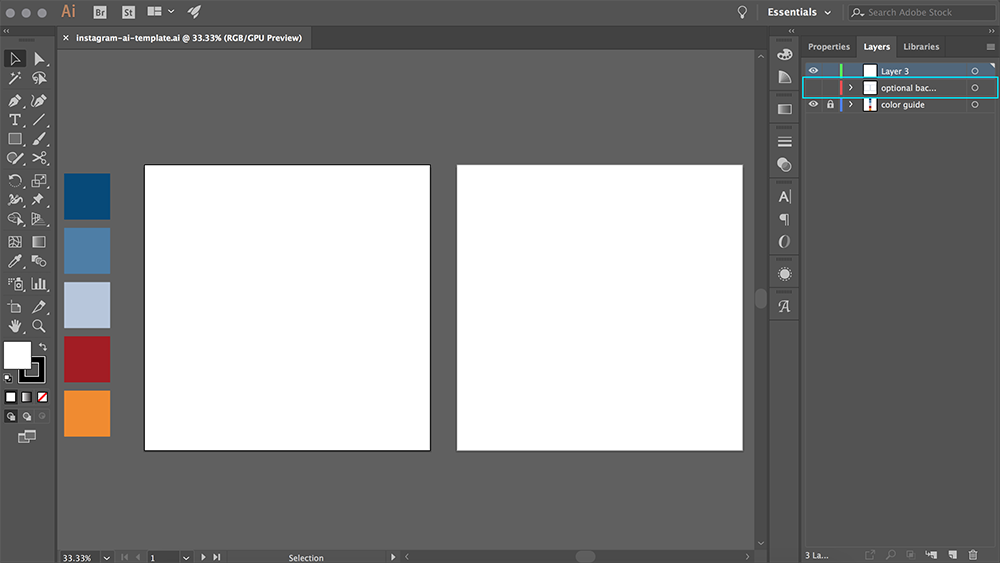
Notes about the template:
- There are two square artboards, each sized 1080×1080 pixels, which is recommended for Instagram. You’ll make two infographics in one file, then export them separately.
- To the left of the artboards are five color rectangles that match the Project Play palette used in their reports and website. You can also use white, black and any shade of gray.
- In the Layers panel on the right, note that there’s an “optional background” layer turned invisible by default. You can use this by clicking the eyeball icon by the layer if it’s helpful to have a starting point.
- The fonts used by Project Play are Proxima Nova and Garamond/Adobe Garamond Pro. You are not required to use these fonts since you may not have them on your computer, but it may be useful for brand consistency if you do have them.
2. Make two infographics!
- Both should include numeric data, and at least one should include a chart.
- Use consistent design choices, including the designated Project Play color palette.
- Think about how to make the graphics eye-catching without introducing chartjunk that obscures the key point.
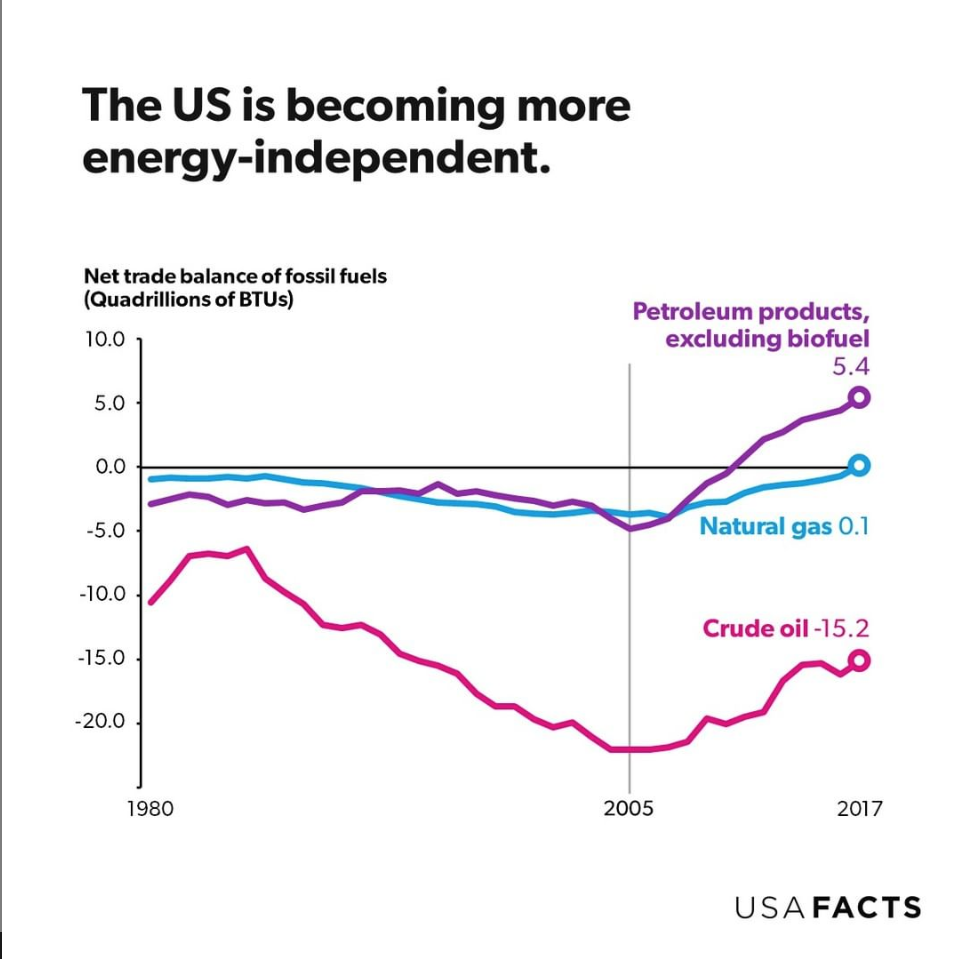
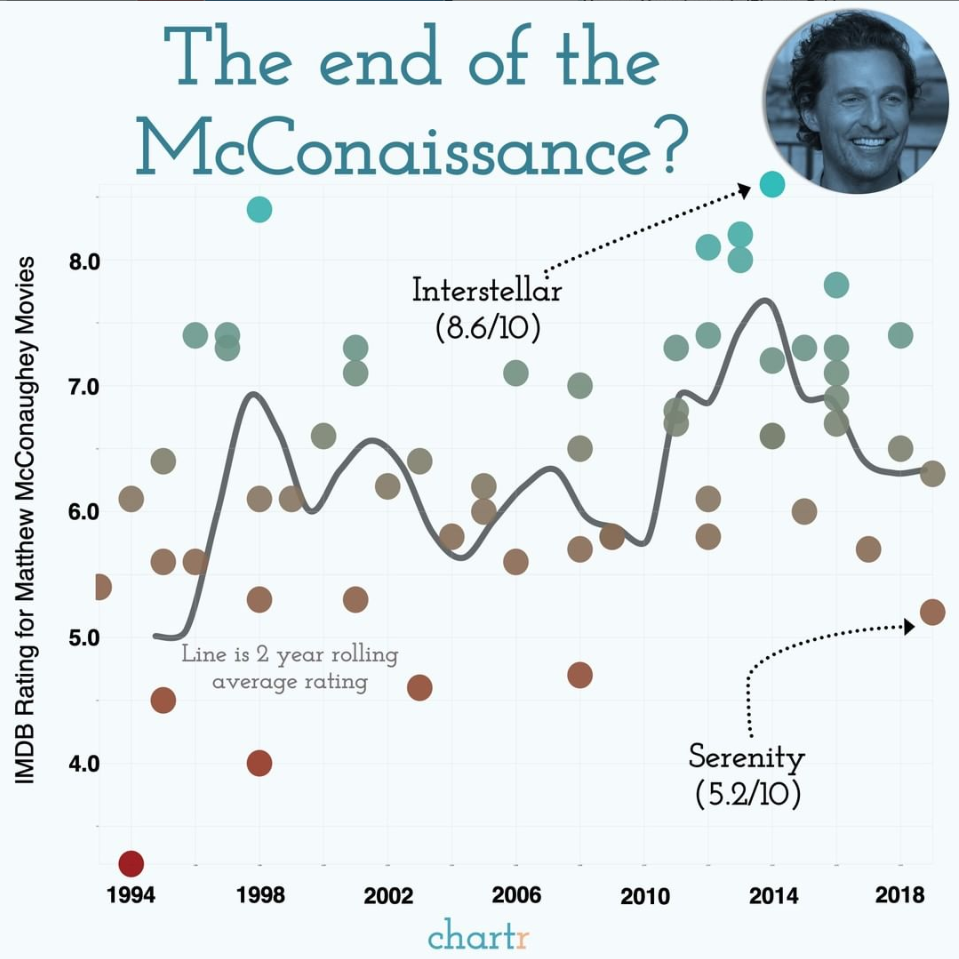
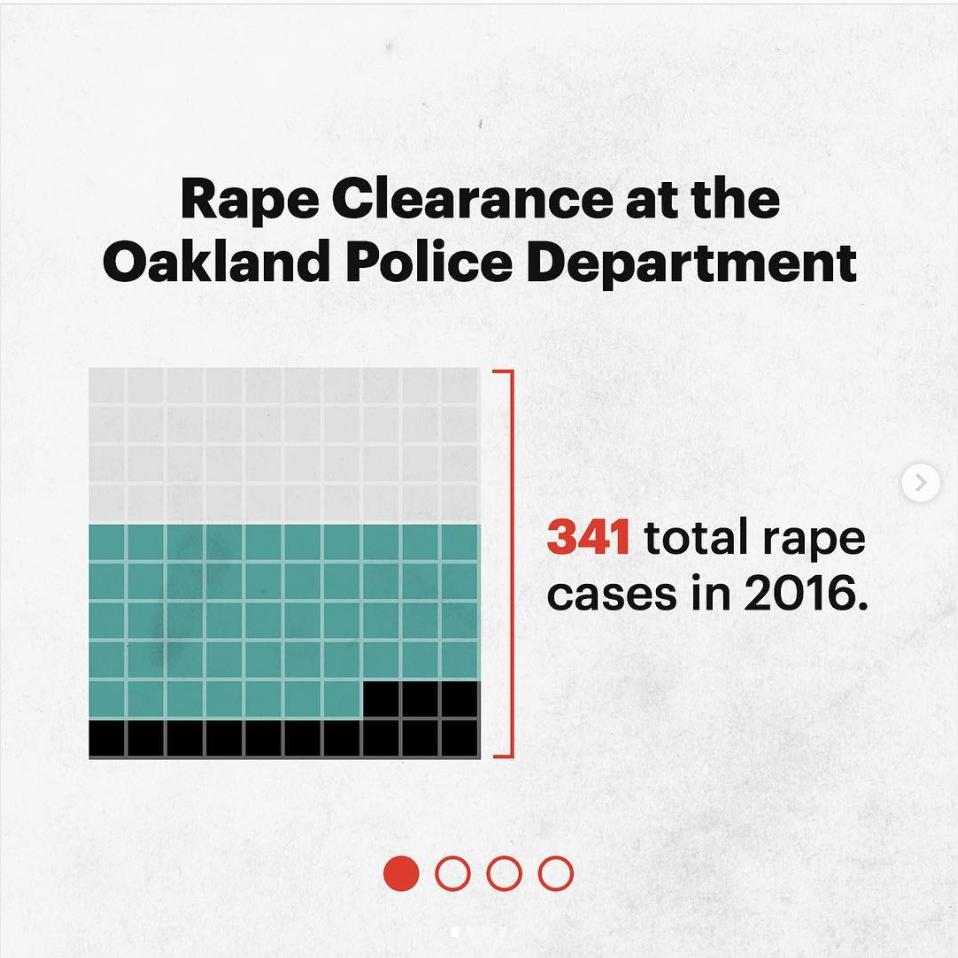
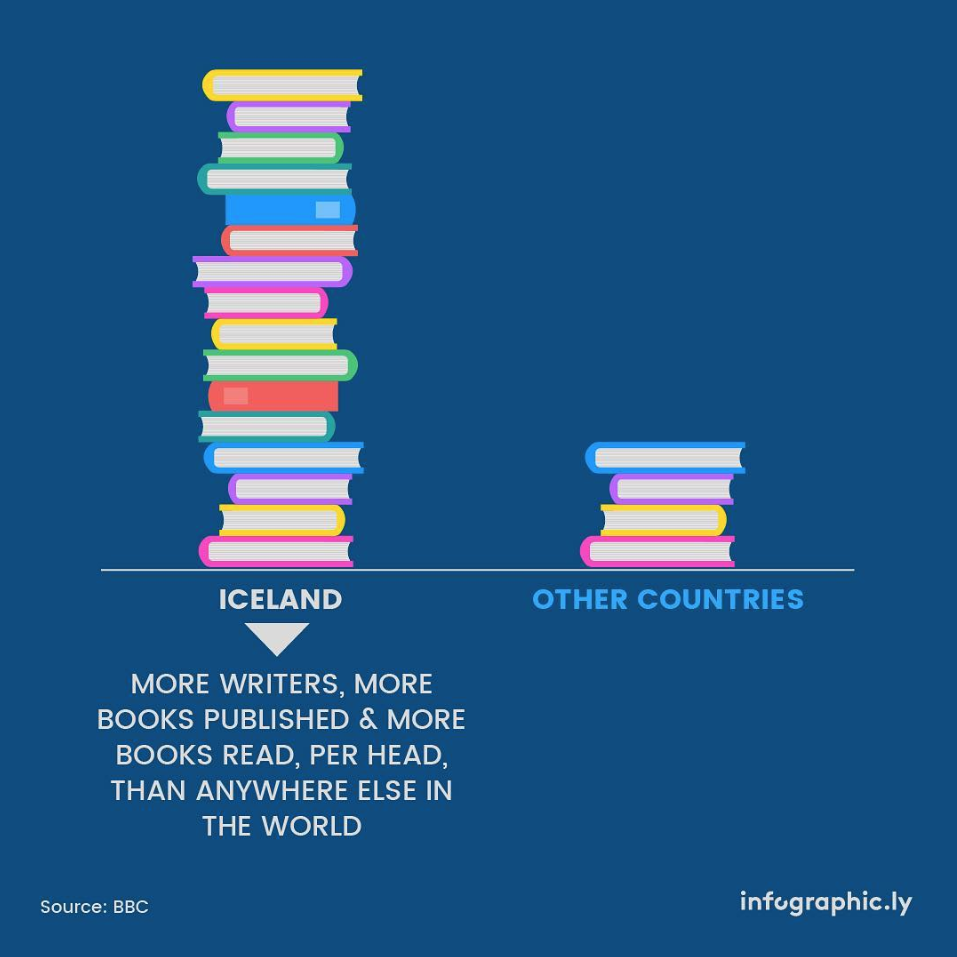
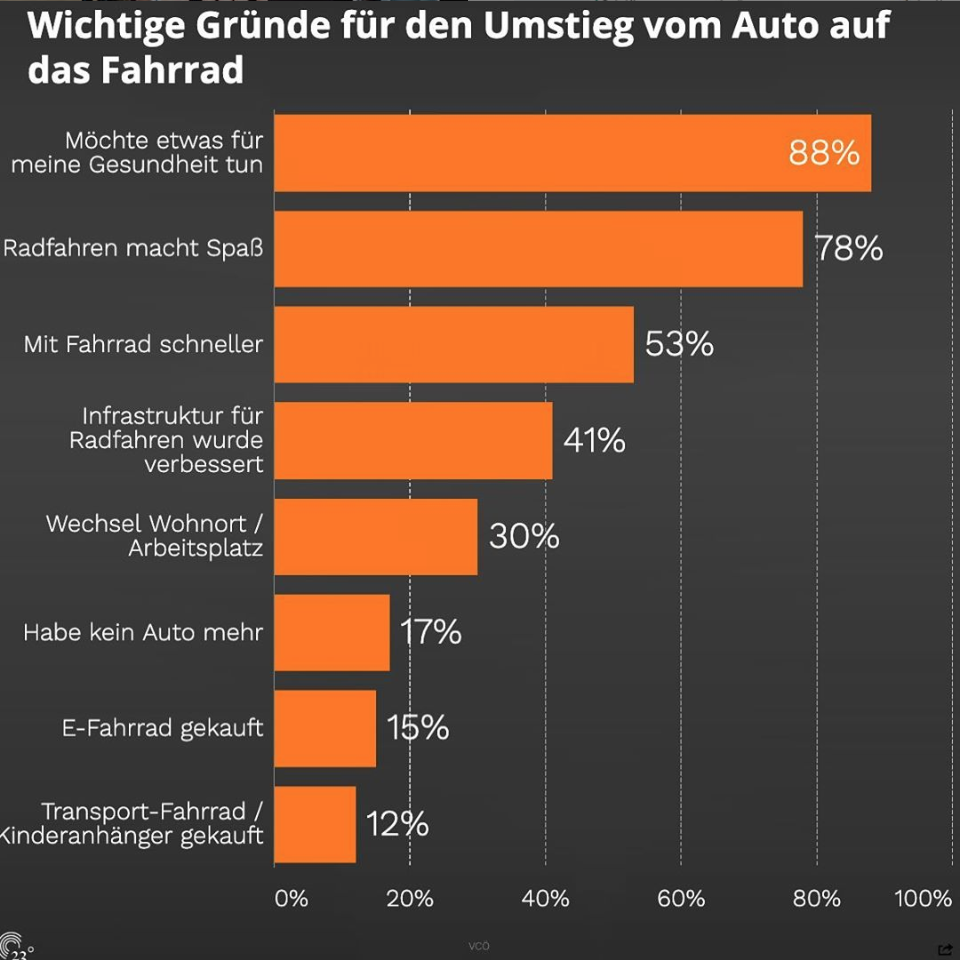
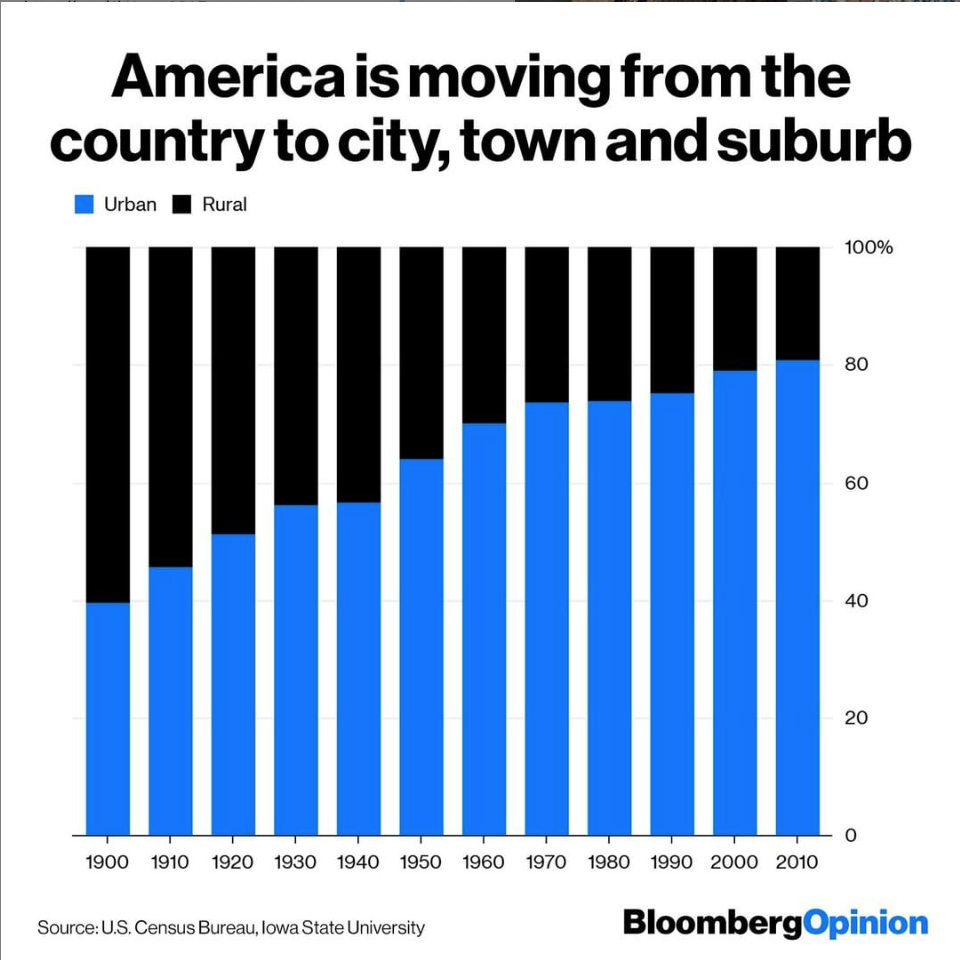
Here are a few examples of Instagram graphics with a range of topics and styles:


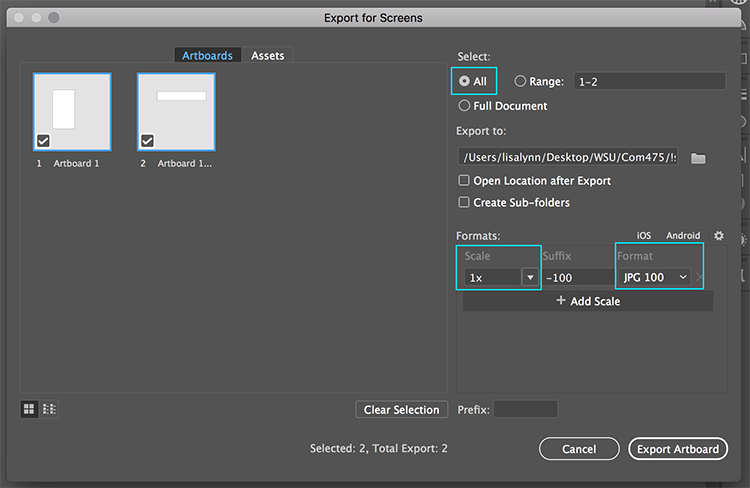
3. When your two graphics are complete, export them as image files.
- Go to File > Export > Export for Screens
- Make sure both artboards are selected, with the scale set to 1x and format as JPG 100
- Both images should export at once. Save the images and your Illustrator .ai file to submit.
Part 2: Interactive Web Tools
You will make two more promotional graphics for Instagram, but this time using interactive web tools. You can use the same information and chart types as you did for the Illustrator graphics, or you can choose new information from the Project Play reports.
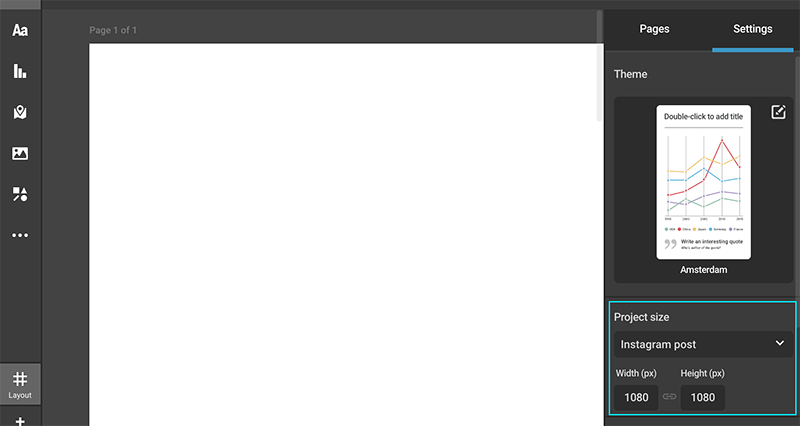
1. Create an Instagram infographic using Infogram (and try saying that three times fast!).
- Sign up at Infogram site: infogram.com
- Choose Infographics as the project type, then choose from a template or use the blank template and add your own elements.
- Under “Settings” on the right, choose Instagram post for the project size.
- Choose colors and elements that are cohesive with the Project Play visual branding, such as the same color palette.
- When you’re done, click the blue “Share” button to get the public link or take a screenshot.
2. Choose one more tool to try from the following list. (You are of course welcome to try more than one, and if one isn’t working out well for you it may be best to just switch.)
All of these tools have a free option, but they sometimes try pretty hard to make you sign up for a paid account! You do not have to pay for anything or choose a “free trial.”
These tools have an option to either download the image or get a shareable public link. Either option is fine for this assignment, but please double-check that the link works even when you are not logged in.
Rating the Web Tools
In a text document, answer the following questions:
- On a scale of 1-10, how would you rate each of the web tools you used, and why?
- In your experience, what are the pros and cons of using these interactive tools compared to Illustrator?
Submitting Your Work
Complete your assignment by submitting the following materials to Canvas:
- Two exported Illustrator images and Illustrator .ai file
- Link or image for Infogram chart
- Link for image for second chart
- Text document with written responses
If you do not have access to Adobe Illustrator, you can instead submit three charts created with three different web tools. If you choose this option, describe in your written response all three and how they compare.