
In this assignment, you’ll be finding examples of data and visualizations in your own life and daily activities.
Part 1: Looking for Visualizations
Collect five examples of information presented visually, from any type of media you might come across. This could be a published news graphic, but you might also find examples in textbooks or magazines, posted on social media, or included on items like fliers, posters, bills, receipts and packaging. (To get full credit, it should be evident you found the example by looking around a little rather than just using results from a generic Google search.)
For each of your five examples, write 1-2 sentences describing:
- The key message that it shows
- Whether it fits any of the chart types discussed in class materials
- Whether it makes use of numerical data
- Whether you think the information comes through more effectively with the visual format
Submit your example in a text document (such as Microsoft Word), with the example included either as a link or image. It is fine to include the image as an attachment instead.
For example…
Here are examples I came across in the course of one evening at home, with descriptions:
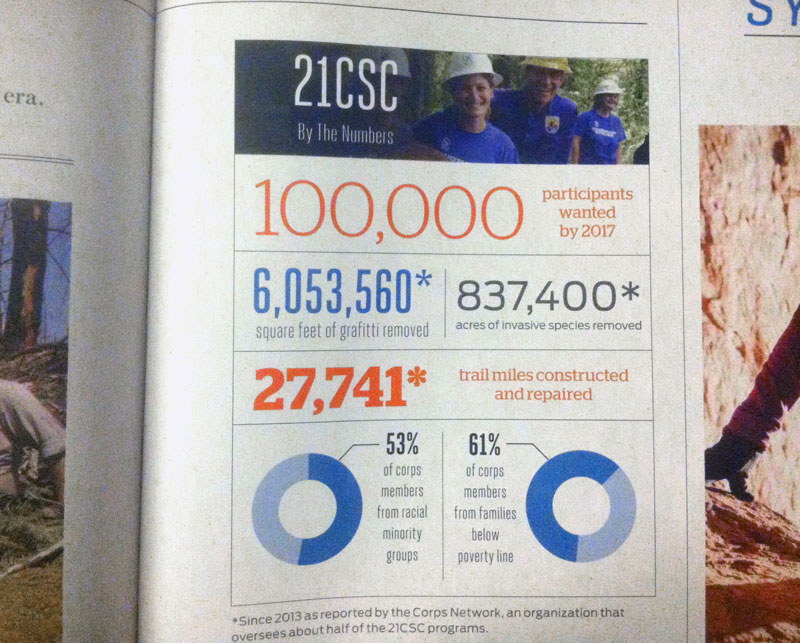
This visualization from Backpacker magazine is showing an overview of the 21st Century Conservation Service Corps, a program run by the Department of the Interior. Two of the statistics are displayed with pie charts (or donut charts), which use numerical data about demographics. The visual format makes the information more eye-catching, but it’s not hard information to understand.
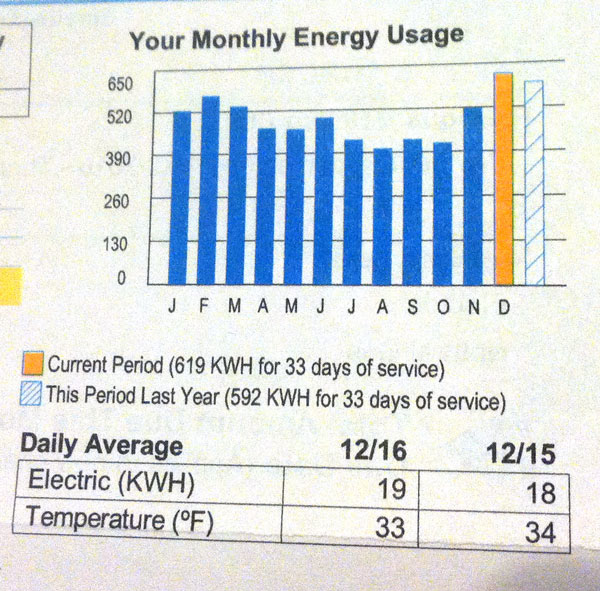
This bar chart from a monthly Avista Utilities bill shows that my household used more electricity this past December than the previous December, using a numerical measurement. The chart makes this fact much more noticeable than if it were just a list of numbers.
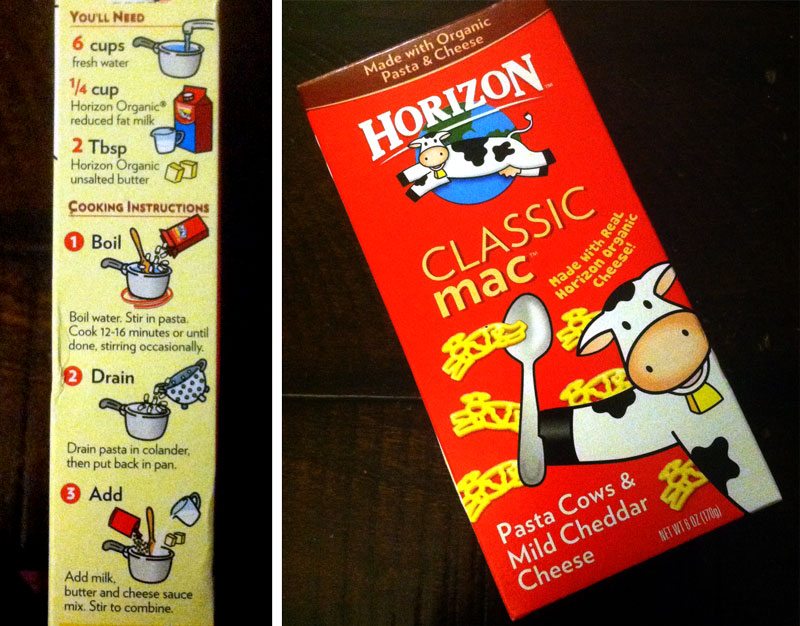
This macaroni and cheese box shows the instructions visually. The illustrations show information, but not numerical data, so they’re not charts. The visuals are useful as a quick reference, but the text is still more important.
Part 2: Identifying Data
Make a list of five examples of data that is currently being collected about you. Think broadly about all the ways your life is measured, even if it doesn’t affect you on a daily basis. For each, write 1-2 sentences explaining:
- Who is collecting the data and why? (You, your employer, a company, etc.)
- Does it fit any of the data types from Chapter 1 of Data + Design?
Submit the Assignment
Complete the assignment by submitting the following materials to the corresponding assignment dropbox in Canvas:
- Text document with five images and descriptions from Part 1, and five written examples from Part 2
Tip! Don’t forget the question for each example of whether it fits any chart types from the class materials (Part 1 examples) or any of the data types from our online textbook chapter (Part 2 examples). You’ll need to go through the video lecture and reading to answer this well. If you’re not sure, it’s okay to say that and explain your best guess.