
In this assignment, we’ll be using data about pet ownership in the U.S. from the American Veterinary Medical Association. This data is collected and published regularly as market research for the association’s members, since the market for veterinary services depends on trends in pet ownership.
1. Choose a specific dataset to visualize that includes at least five different values. You can download or view this compressed version of the full report our class website. (It’s a large file and make take a little bit to download. This is also available on Canvas under this week’s module heading.)
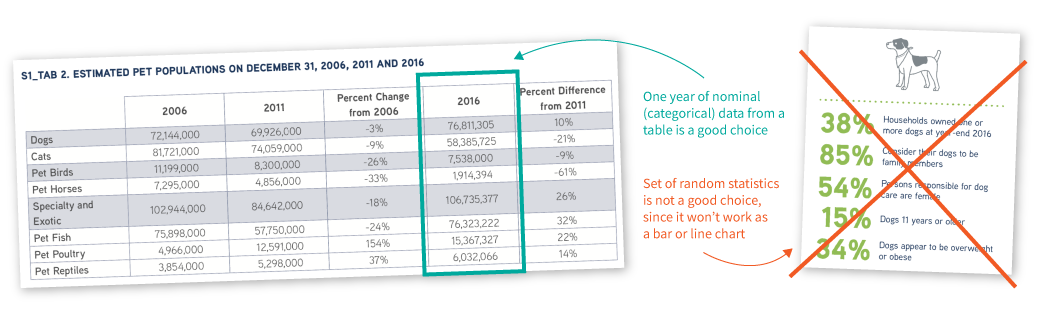
Choose data from one of the tables in the report that shows comparisons between categories or change over time. Another way to think of this is choosing data that makes sense as a bar chart or line chart, not a random collection of numerical facts.
If you’re unsure or don’t feel like browsing, use the data in the following table, which is from Page 14:
Percentage of U.S. Households that Own Pets, by Animal Type (2016)
| Pet | Ownership |
| Dog | 38.4% |
| Cat | 25.4% |
| Specialty/exotic | 13.3% |
| Bird | 2.8% |
| Horse | 0.7% |
2. With your selected data, create a chart that follows Edward Tufte’s design principles.
- You can use any software for this. Google Sheets or Excel should be sufficient, but you’re welcome to try out Tableau, Illustrator or a web tool like Datawrapper or Flourish.
- Make sure to include enough labels and text to fully explain what the chart shows.
- Make deliberate design choices about all parts of the chart, including color, font style and size.
3. Create another chart showing the same data, only this time go crazy with the chartjunk! Normally this is not a best practice, since chartjunk obscures the data. But here’s your one chance to throw caution to the wind and make a chart that doesn’t give a damn what Tufte thinks.
- You can again use any tool or combination of tools. PowerPoint or Canva is good bet for adding patterns and clip art. Or, you could take a screenshot of a web chart and add decoration in a different program.
- Chartjunk doesn’t have to be unattractive design, though you are welcome to go that direction if you want. Think about how you can go over the top with decoration, patterns, color, 3D effects, illustration, or other elements that distract from the data.
3. Save both charts in an image format you can submit to Canvas, such as JPG, PNG or PDF.
4. In a text document, answer these questions:
- What about the first chart fits with Tufte’s design principles?
- What about the second chart makes the design elements qualify as “chartjunk”?
- Do you think the American Veterinary Medical Association PDF report that you used as a data source is designed well? Point out two specific design choices in the report to support your assessment.
Submit the Assignment
Complete the assignment by submitting the following materials to the corresponding assignment dropbox in Canvas:
- Two charts (one without chartjunk, one chartjunk-crazy)
- Your written responses to the questions