
Any establishment that sells alcohol in Washington state must have a license from the State Liquor Control Board. In this assignment, we’ll use Google apps to map all the licensed businesses in Whitman County, which is home to WSU’s Pullman campus.
Preparing the Data
1. We’re going to use data from the Washington State Liquor and Cannabis Board (WSLCB). The state agency gets many requests for lists of all issued licenses, so commonly requested files are available to download from their website here: http://www.liq.wa.gov/records/frequently-requested-lists
The WSLCB spreadsheets include data for the whole state and many columns of information for each license. For this assignment, you get to use a CSV file with information about licenses for Whitman County businesses. (Whitman County, home to WSU’s Pullman campus, is a good example for this assignment because it has a manageable number of businesses. But the process works the same way for any other Washington county, and you can complete this assignment with a different county if you are comfortable filtering the state’s raw data yourself.)
Download and save the CSV file from this folder: WSLCB data downloads
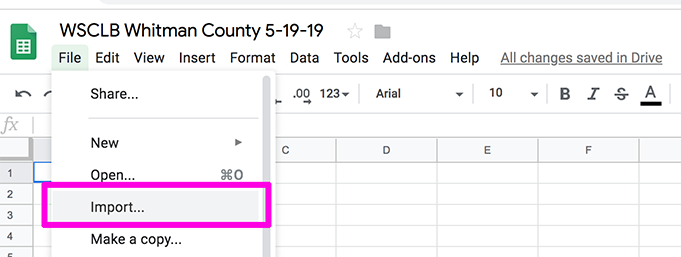
2. In Google Sheets, create a new spreadsheet and give it an appropriate name. Go to File > Import > Upload and add the CSV file.

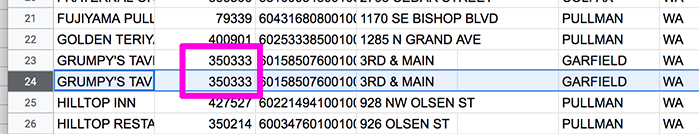
3. Before we can map things, you’ll need to edit the data in a few places to make it appropriate for mapping. First, go through the License Number column and look for licenses that are listed more than once (in most cases the business name will also be the same). As long as the two rows show the same address, delete extra rows so each license number is listed only once. You should end up with just less than 100 rows. Here is a very short video about how to delete rows.
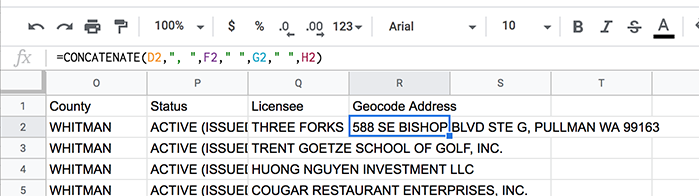
4. To map the addresses, the full address must be in one cell instead of having the street address, city and zip code in separate cells. At the far right of your spreadsheet, name a column Geocode Address.
We’re going to fill in that new Geocode Address column with a formula:
=CONCATENATE(D2,", ",F2," ",G2," ",H2)
The concatenate function combines text from different cells. In the formula, the commas separate the cells you want to combine, and anything inside quotation marks also gets added as text. (In this case, the quotation marks encase a space, because otherwise the address information would get smushed together. We’re skipping Column E since it’s not important for the address.)
Hit enter to apply the formula, and use the formula bar right above the spreadsheet if you need to edit it.
Once you have the formula working in the first row, double-click the blue square in the bottom corner of that cell down to copy the formula down into the remaining empty cells. (You can also copy the formula down the column by dragging the little blue square.)
5. On the far right end of your spreadsheet, add a new column labeled Category. This will differentiate the two main types of liquor licenses.
Not all the locations on the list have the same type of WSLCB license. Locations have either an On Premise or Off Premise license, which indicates whether they’re allowed to serve alcohol at that location or just sell it for consumption elsewhere. (Bars have on-premise licenses, for example; grocery stores have off-premise licenses.) There are also a variety of more specific license types, such as “beer/wine restaurant” and “grocery store.”
In our spreadsheet, the On-Premise locations are listed first alphabetically, then the Off-Premise locations are listed. You can also tell whether a location is on- or off-premise by looking at the “Privilege” column.
In the first cell of this column, type On-Premise and drag down to copy this to all the other rows. Put “Off-Premise” for those locations in the lower half of the spreadsheet.
Making the Map
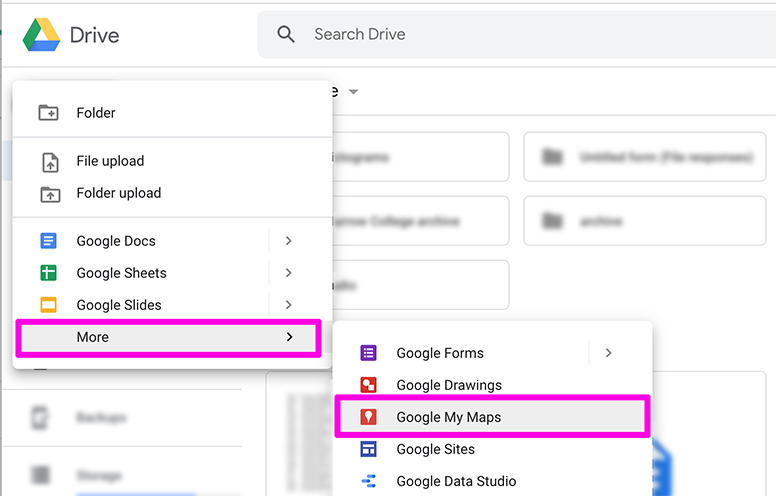
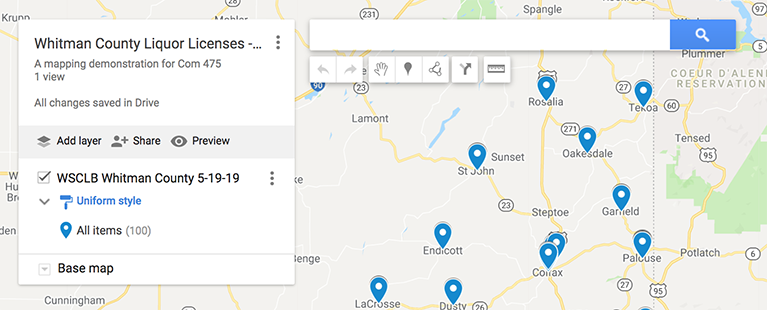
6. Now it’s time to map the data with Google Maps. In Google Drive, click New > More > Google My Maps. (If you don’t see it in your list of apps, click the “Connect more apps” button at the bottom of the list.) You can also get to My Maps at google.com/maps/d/
- Give your map an appropriate name in the box in the top left.
- Under “Untitled layer,” click the blue “Import” link.
- Choose the option for Google Drive, then locate the spreadsheet you just edited.
- When it asks you to “Choose columns to positions your placemarks,” choose the Geocode Address column that contains the full addresses.
- When it asks you to “Choose a column to title your markers,” choose the Tradename column that has the business names.
- Then it should load your placemarkers and zoom to Whitman County!
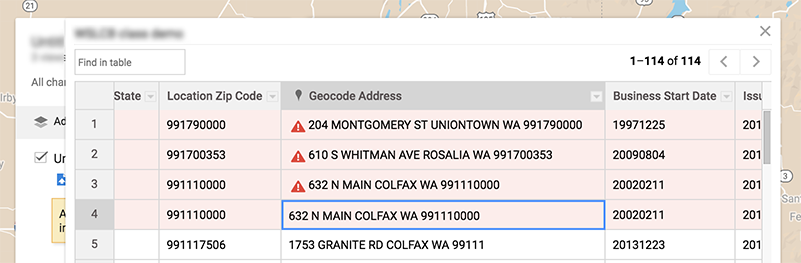
Sometimes it won’t be able to locate all the addresses, and will give you an alert that some rows could not be shown on the map. This yellow alert box allows you to click on “Open data table,” where you can check the addresses and make adjustments if necessary. For instance, it sometimes gets confused by addresses that include apartment or suite numbers. Here is a very short video about how to adjust addresses that Google couldn’t locate.
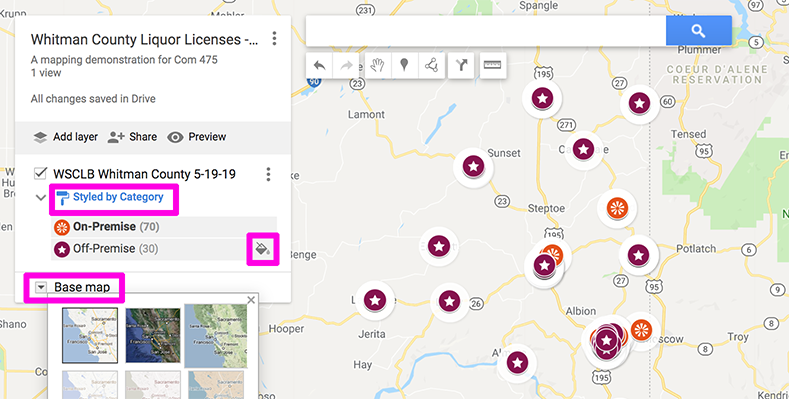
7. Now you can style your map to adjust the appearance of the markers and the base map underneath.
- The default placemarker style is “Uniform Style.” Click that blue link and choose “Style by data column,” then find the Category column where you differentiated between on-premise and off-premise licenses.
- To change the default colors for the two categories, click the paint bucket icon and choose a new color or symbol (or both).
- Zoom in to Pullman so you can see how it looks up close. Then click the dropdown arrow by “Base Map” and choose which of the nine background styles seems most appealing and useful.
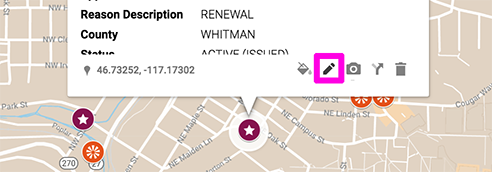
8. Finally, we’ll adjust what information shows up if you click on a specific placemarker.
- Click any placemarker on the map. At the bottom of the popup box, click the pencil icon to edit what information appears.
- Un-check the information that is redundant or irrelevant to most viewers, like the license number. Make sure the full address still appears, and some other columns like “Privilege” might interest people.
9. Click the “Share” icon in the white box, and change the access so anyone with the link can view the map. Save the link to submit later.
Written questions
In a separate document, answer a few questions about your map and other map ideas.
1. How did you decide which styles to use for your placemarkers and base map?
2. What is one example for a specific use of this map, and how could you improve the map for that particular audience or purpose? (For instance, this map could have very different purposes if it were used by a food inspector vs. shared by the chamber of commerce.)
3. What are two other ideas for point data related to your personal or career interests that might be interesting to map using this process?
4. This data is available for all counties in Washington state. What do you think the state map would look like if all liquor licenses were mapped as point data?
Submitting Your Work
Complete your assignment by submitting the following materials to Blackboard:
- Your map link (make sure to test it when you’re not signed in)
- Text document with written responses