
Building on the previous assignment in Tableau, you will now learn how to combine those charts into a single “dashboard” to explain the story with multiple visuals.
Tableau Dashboards
1. Reopen your previous Tableau Public project containing four charts about WSU tuition.
2. Using the four charts you created in the previous assignment, you’ll combine all four into a single presentation. Tableau calls this a dashboard.
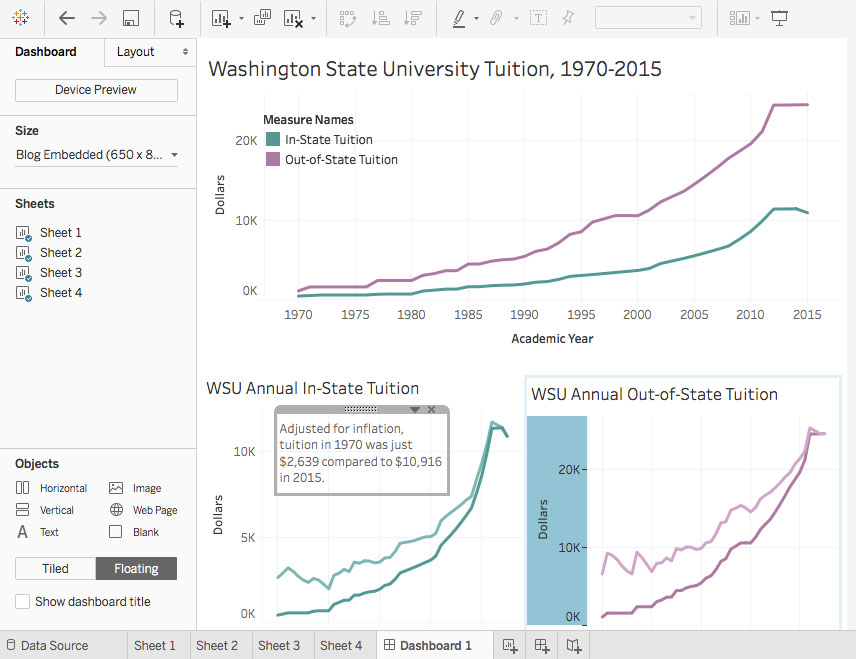
- Click the “New Dashboard” button, to the right of the New Worksheet button.
- On the left under “Size,” click the arrow dropdown to choose “Fixed Size” and “Web Page Embedded 800×800.”
- Toward the bottom in the left column, choose “Floating” instead of “Tiled.”
- From the left, drag “Sheet 1” into the dashboard space in the middle. Adjust the box so it’s positioned at the top, stretching all the way across. Position the key in some open space within the chart.
- Place the second and third charts next to each other immediately below the first chart. Try to make them exactly the same size.
- Place the fourth chart at the bottom, extending all the way across. You can delete the key for this chart since the precise color values are not important in this case.
- Under Size, change the format to “Blog Embedded 650×860.” Notice that your charts change proportions automatically. Change the format to any size that you think will work well for these charts, and adjust the chart sizing if necessary.
- You can still make changes to your charts at this point if you need to. Double-click on the title of any chart to bring up the text and formatting options. Make the font size a bit smaller for all the charts except the top one.
3. In the dashboard view, you can add other elements such as text and images.
- Drag the “Text” element onto your dashboard to create a blank text box.
- Copy this fact into your text box: “Adjusted for inflation, tuition in 1970 was just $2,846 compared to $10,511 in 2019.”
- Place this box into open space on the in-state tuition chart with the inflation-adjusted line.
- Add at least one other text box with a fact about one of the other three charts. Consider what you’d want your audience to know about each chart.
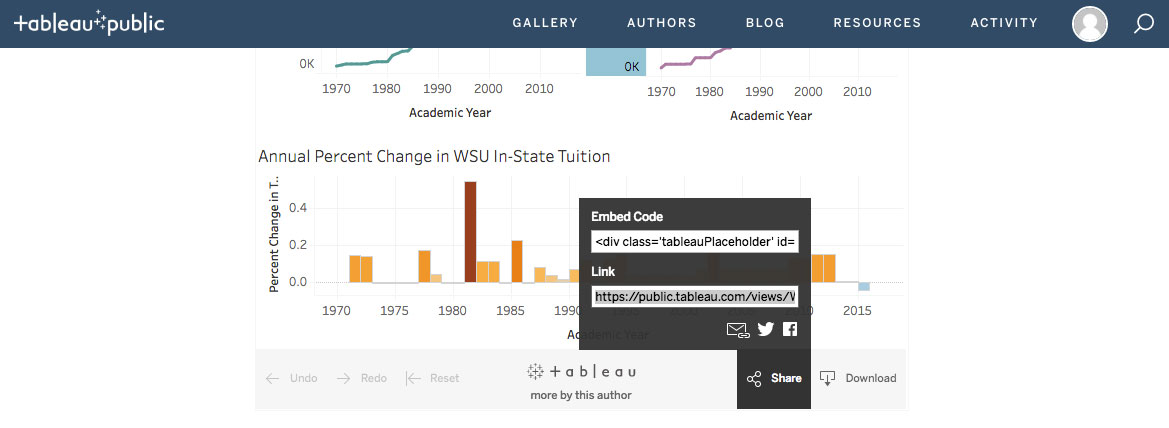
4. Now it’s time to publish your finished interactive. Click the Save button, and overwrite your previously saved version. Your finished dashboard should come up automatically in a web browser window, or you can navigate to your Tableau profile.
Hopefully, it looks great! At this point you could embed this into a different website or blog post. For the purposes of this assignment, copy the public link from the “Share” options at the bottom, and save this for your Blackboard submission.
Written Responses
Answer the following questions in 1-2 sentences each:
1. Do you think it is valuable to have a collection of charts presented together in this instance, or would it be better to choose the single strongest chart?
2. What is another chart about WSU tuition that you’d be interested in seeing? (Don’t worry about whether the data is actually available.)
3. What do you think of Tableau at this point? Was your experience mostly positive or mostly negative?
Submitting Your Work
Include the following with your Canvas submission:
- Your link to your Tableau Public dashboard
- Your written responses from Part 2