
In this assignment, you’ll use several web tools and Illustrator to create a cartogram about national Google search data.
Making a Cartogram
1. Google Trends is a way to view what people are searching for on Google. You can enter any word or phrase to see how searches for that particular word or phrase have changed over time or by geography.
- Go to the Google Trends page and try out a few different search terms to see how it works. (Try out “seahawks” or “sasquatch” if you’re not sure where to start.)
- Think of a search term that might vary by geography in the U.S. This can be a phrase, celebrity, food, TV show, political issue, fashion trend, sports team, etc. It can be serious or fun.
- Once you enter a term, you can preview the map below and see if it’s interesting. You can change settings like the time range.
- Download the data by clicking the download arrow near the map. The numbers you see for each state are relative, with the highest state given 100 and the others relative to that maximum.
- The data will download as a CSV file, which you can import into a spreadsheet to make it easier to look at.
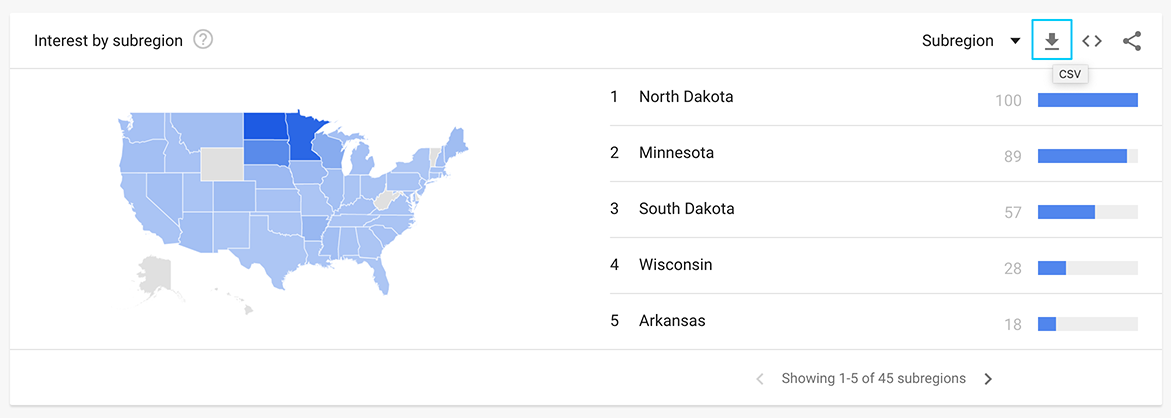
I chose the term “hot dish,” which I know is a very Minnesotan term for casserole. Other weird Minnesota lingo includes “duck duck gray duck” instead of “duck duck goose” for the children’s game.
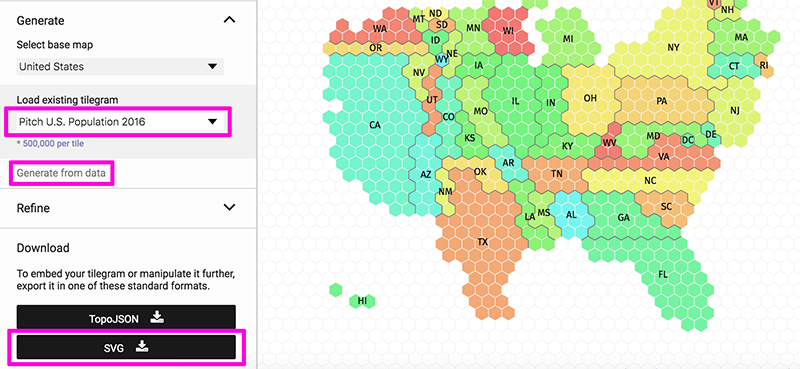
2. Create a cartogram template using the Tilegrams tool.
- Go to the cartogram generator: Pitch Interactive Tilegrams
- Change the “Load existing tilegram” field to Pitch U.S. Population 2016. (For other types of data, the other options might be more appropriate.)
- Click the “Generate from data” link and use the slider to change the number of tiles. You can also drag them around to change the design. Try to make sure states aren’t split into two pieces! (Unless they actually are, like Michigan.)
- Once you have the design the way you want it, click the SVG button to download the tilegram.
- If you have any trouble or want to know more about the Tilegrams tool, this document has additional resources.
3. Edit the tilegram in Illustrator to show your selected data.
- In Illustrator, go to File > Open to open up the exported Tilegram file. Zoom in and out using the keyboard shortcuts or under the View menu.
- Go to File > Save As and change the format from SVG to .ai to save it as a regular Illustrator file.
- You’ll need a color scale to represent the range of values. Use Color Brewer to choose a sequential color scale with 4 or 5 categories. You can use the eyedropper tool directly in Illustrator to pick up the colors, or you can add the hexcodes.
- To assign colors to each state, it may be helpful to sort your spreadsheet. There are different approaches to creating color scales, but one option is having about the same number of states in each color category.
- Note that the Layers panel in Illustrator has each state in a separate, labeled layer to make sure you’re applying the correct color to each state.
- You may want to include a white border or “stroke” on the shapes so they stand out from one another.
This video shows a demonstration of the color process in Illustrator:
4. Use text boxes to label your cartogram and add a key.
- Include a title so it’s clear what the map shows. (Include the search term and explain it represents Google searches, and make sure to mention any factors like if you limited the time range.)
- Create a color key showing what the different colors mean.
- Add a source or credit line to show that the data comes from Google.
- Label the highest state and lowest state, if there is one, so we can easily see the extremes. (It’s not a requirement to label other states, but you are certainly welcome to do so.)
- Consider any other text or labels that would help someone understand this map and what’s interesting about it.
5. Export a finished graphic by going to File > Export > Export As and choose JPG. This is the file you’ll submit.
Submitting your assignment
Under Assignments in Blackboard, find the corresponding dropbox for this assignment. Include the following with your submission:
- Illustrator .ai file
- Exported JPG file with completed cartogram