
Slicing the Pie
One common mistake I’m seeing with a few assignments is including the “total” row or field when it’s not necessary. This is especially noticeable with pie charts, since the “total” slice will always be half the pie if it’s incorrectly included.
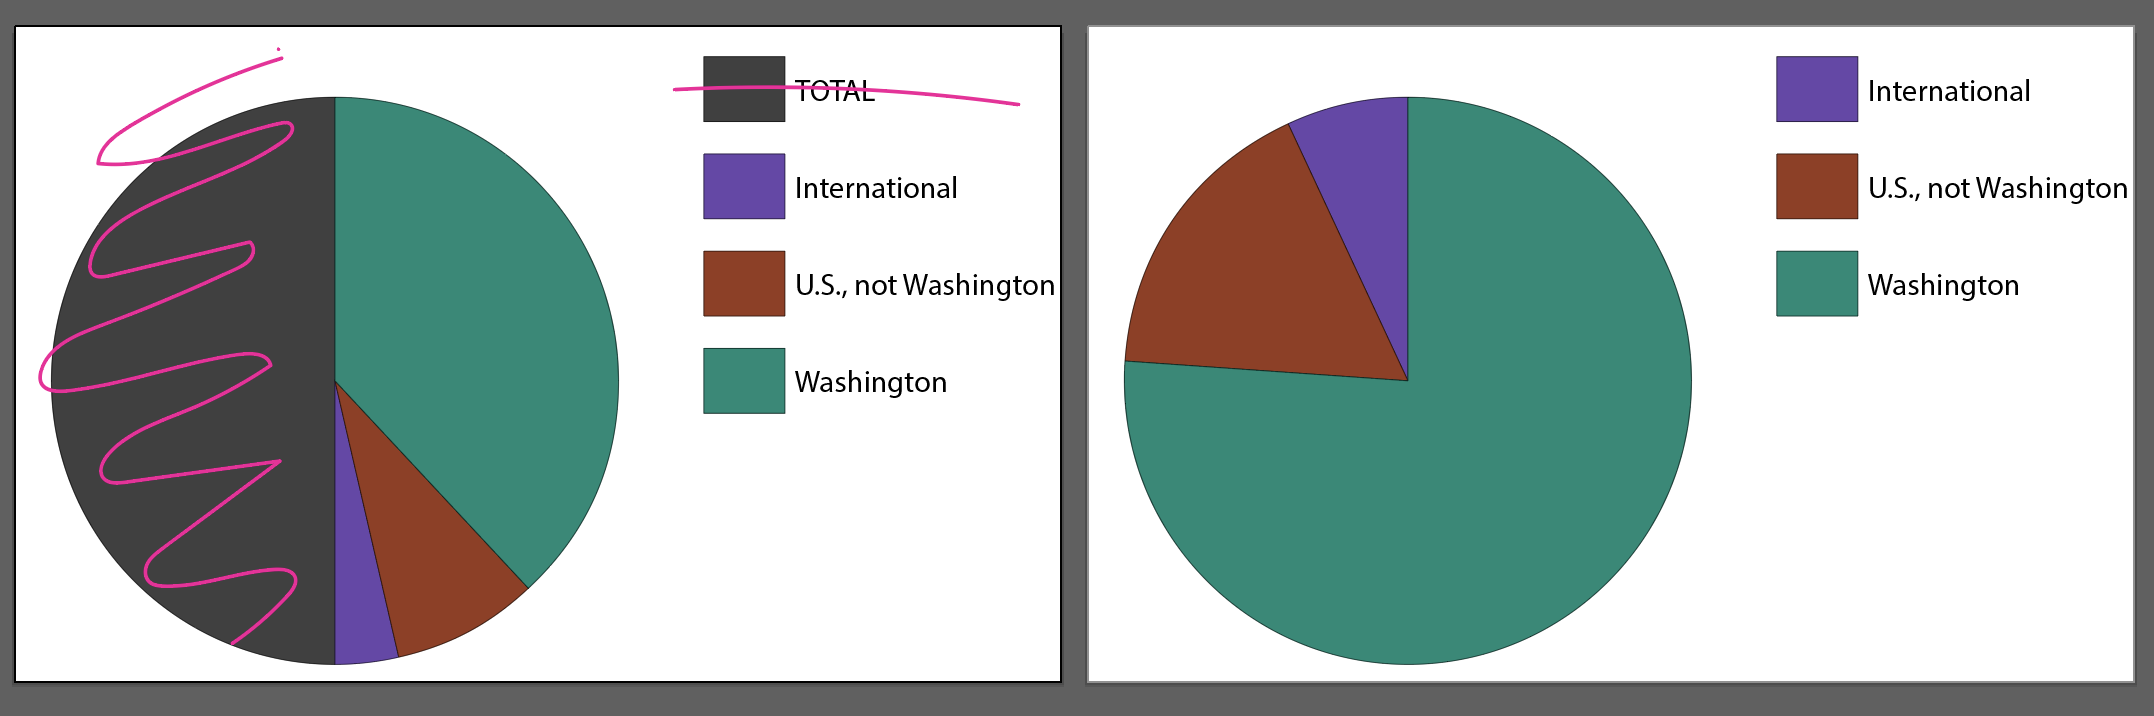
But sometimes doing this intentionally can help you make a half-circle pie chart variation. This video shows a couple ways to get rid of the “total” slice and shows a demo of making charts in Adobe Illustrator.
Warm-Up Activity
We’re going to start with a quick drawing activity. Do this before you go through the rest of the lecture materials. No cheating!
- Get a blank piece of paper and something to write with.
- Set a timer for 2 minutes.
- Draw a map of Washington state before the time runs out. Go! Don’t worry about getting every detail perfect — just do what you can.
How did that go? Set that paper aside for now, but you’ll use it later for the lecture discussion.
Lecture: Maps & Cartography
This week we’re focusing on a type of visualization you probably have lots of experience with: maps. We all use maps in our everyday lives, but making maps requires thinking about them differently. There is also a key difference between the reference maps we use to get around, and thematic maps that display data geographically.
Follow along with the slides here: All About Maps
Video not showing up? Watch on YouTube here.
Readings
• Introduction to Map Design (Esri)
• The Cartographer Who’s Transforming Map Design (Wired) PDF version if the article won’t load
Discussion
Do you still have that map of Washington that you drew earlier? Now we’ll share them with some context.
Draw Washington: You should have already done most of this earlier when you drew a map of Washington state in 2 minutes. Upload an image of your drawing to the discussion forum (insert the image into your comment, not as an attachment) and write about the following:
- How did you approach the map? Where did you start?
- What turned out well? What turned out poorly?
- Do you have any particular advantages or disadvantages for doing this? (For example, I would have been terrible at this back when I was a WSU student because I didn’t grow up in Washington.)
Assignment 14: Mapping Point Data
In this assignment, we’ll use Washington State Liquor and Cannabis Board data to map all the liquor licenses in a particular county.