
Looking Under the Hood
Since this is an introductory class, we’re not spending a lot of time talking about the underlying technology of the visualizations we’re making. There are great tools, like Tableau and others we’ve used, that allow you to make interactive graphics without knowing any code. But if you are interested in doing more advanced data or visualization tasks, like web scraping to collect data or fully controlling the design of a visualization, then learning code is the next step. An awesome thing about code is that most libraries and resources are open-source, meaning the underlying code is freely available to see and use, unlike proprietary software like Adobe programs or even Tableau.
So I am here to reassure you that 1) you won’t need to code in this class except for one tiny thing today, and 2) it’s not scary or all that difficult if it’s something you want to learn!
The hardest part is knowing what to learn and where to start. I am very happy to suggest resources, tutorials or tools if there’s anything you want to learn beyond the scope of this class.
Lecture: Evolution of Visualization Technology
What exactly are interactive graphics made from? Pixels controlled by code, just like everything else we see online, but also the individual screens of users. And that means the rise of smartphones and mobile transformed interactive graphics in a couple of important ways.
Follow along with the slides here: Evolution of Visualization Online
Video not showing up? Watch on YouTube here.
As mentioned in the video, D3.js is a very popular library for building interactive data visualizations. It is open-source, meaning anyone can use it and build with it free of cost (unlike propriety software such as Adobe software). Watch this brief introduction video with the author of one of the first guides about using D3, which shows examples of how it works.
Using D3 requires some background skills in web development that we don’t have time for in this course, such as the basics of building web pages with HTML and CSS. But all of these concepts are well within your reach if it’s something you want to pursue.
Trying it Out
We’ve made charts with Google Sheets already, but let’s try out Google Charts real quick. This is based on the video demo at the end of the lecture, so you can refer to that if you get stuck on the process.
Go to the Google Charts gallery. Let’s start with a pie chart. Each chart page includes the documentation, which is text and examples explaining how to use code.
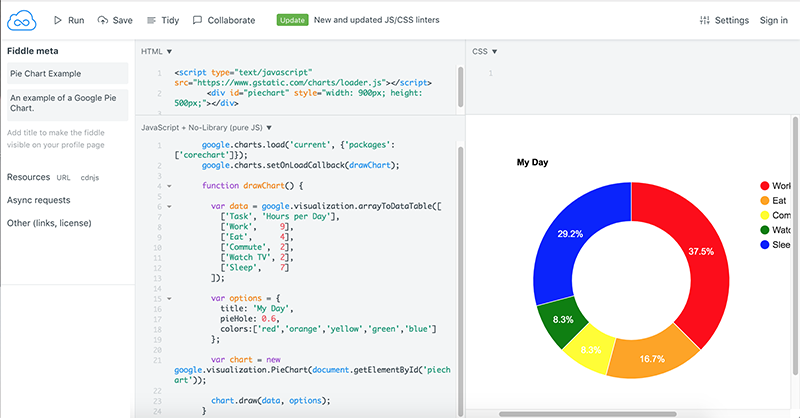
Click the link under the pie chart that says “Code it yourself with JSFiddle.” JSFiddle is a little app that lets you try out different things with code. There are four main panels: HTML and CSS at the top, the Javascript and the preview/output at the bottom. We’re going to work in the Javascript window. Change the red numbers in the middle (the data for the chart) and then click the “Run” button at the very top left of the webpage.
Customize the pie chart to reflect your daily activities by changing the numbers and labels. If you go back to the documentation, it shows you how to turn your pie chart into a donut chart or make it 3D (which is generally discouraged, but fun to try). Take a screenshot of your chart so you can share it in today’s discussion!
Reading
• What interactives can do (that articles can’t)
This reading builds on some of the previous arguments for and against interactivity, with a well-curated list of classic interactive stories and graphics that pushed technical boundaries at the time.
Discussion
Let’s share the charts you made with code!
Google Charts: Include a screenshot or image of your customized chart (pie chart or other) and answer these questions:
- Do you have prior experience with any type of coding, or an interest in learning more? (It’s completely fine to be honest!)
- Did the Google Charts code work well for you, or was it confusing?
Assignment: Esri StoryMaps Tour
In this assignment, you’ll use the Esri StoryMaps platform to build a map-based data narrative.