
How much does the average American eat in a year? In this assignment, you’ll interpret federal government data on food availability and create a pictogram to show how Americans’ food consumption has changed over time.
Find Data
In this part, you’ll be choosing data to use for your chart. It’s strongly recommended that you read through all the steps for Part 1 before getting started so you know where this is going when you select your data.
1. There will be several files you’re saving for this assignment, so it’s a good idea to create a new folder on your desktop to collect everything.
2. The United States Department of Agriculture (USDA) has department called the Economic Research Service, which collects and publishes data on many topics related to U.S. agriculture issues. We’re going to be using information from the Food Availability (Per Capita) Data System. Before we look at the data, read the FAQ page that explains limitations of the data: http://www.ers.usda.gov/data-products/food-availability-per-capita-data-system/faqs/
3. Look at the list of data tables available to download from the Food Availability (Per Capita) Data System page: http://www.ers.usda.gov/data-products/food-availability-per-capita-data-system/
You will choose your own food product to feature in this assignment. (We’re going to use cheese as the example here, so you may not choose cheese. You can choose a specific type of cheese if you want.) Download and look through the available data files to find a product you want to feature. It’s ideal to choose a product where consumption has changed significantly over time, and where the final year is 2010 or later.
In most cases, look for the “Per Capita Availability” label. Some of the spreadsheets split products into categories that are difficult to understand. Make sure you are looking specifically at consumption data, and if anything is unclear you should read the documentation or choose a different product. Per capita means “per person,” so make sure the amount and unit seems plausible. For example, it seems reasonable that a person could consume 26 gallons of coffee in a year (1.14 cups per day), but not 3,200 pounds of coffee. That would be more than eight pounds of coffee each day!
4. Within your chosen spreadsheet, use a color to highlight the data that applies to your product. You might also want to copy this data into a new spreadsheet to avoid getting it confused with the other columns. You will need this data later on, after you finish the pictogram.
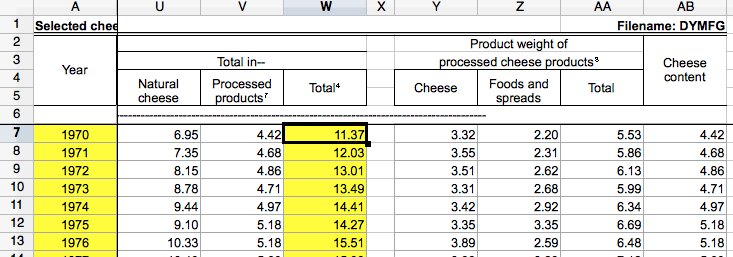
Highlight the data you’re going to use. The spreadsheets are organized differently for different food products, so you need to read carefully.
5. Your pictogram will compare two years to show an increase or decrease over time. In a new tab or spreadsheet, create columns for the year and the values for the oldest data point and most recent data point. Then, create a column to translate those amounts into whole numbers to calculate the number of icons you’ll need to represent consumption in each year.
Also consider whether the unit given in the spreadsheet makes sense to people — for example, it may make sense to count eggs by dozens, or to convert gallons of coffee to cups of coffee.
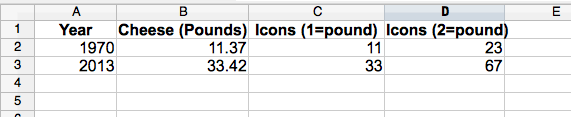
With the example cheese data, the units work well for making 1 icon equal to 1 pound.
If your numbers are smaller than 5 or larger than 30, you will need to do a little math to reach a manageable number of icons. For example, if you want to show a value of 100, you might use 20 icons with each icon representing a value of 5.
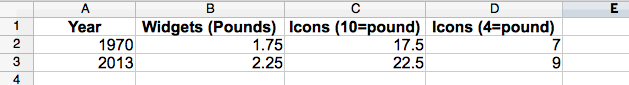
You may need to try different numbers to find one that works well. For small numbers, you may be able to change the unit, like changing gallons to ounces.
Chart the Data as a Pictogram
In this portion of the assignment you’ll use your data to create a pictogram chart.
1. Illustrator is an excellent software program for creating scalable icons, but in this case we’re going to find icons to use from The Noun Project. Go to the website and search to find an icon that represents your food product: https://thenounproject.com

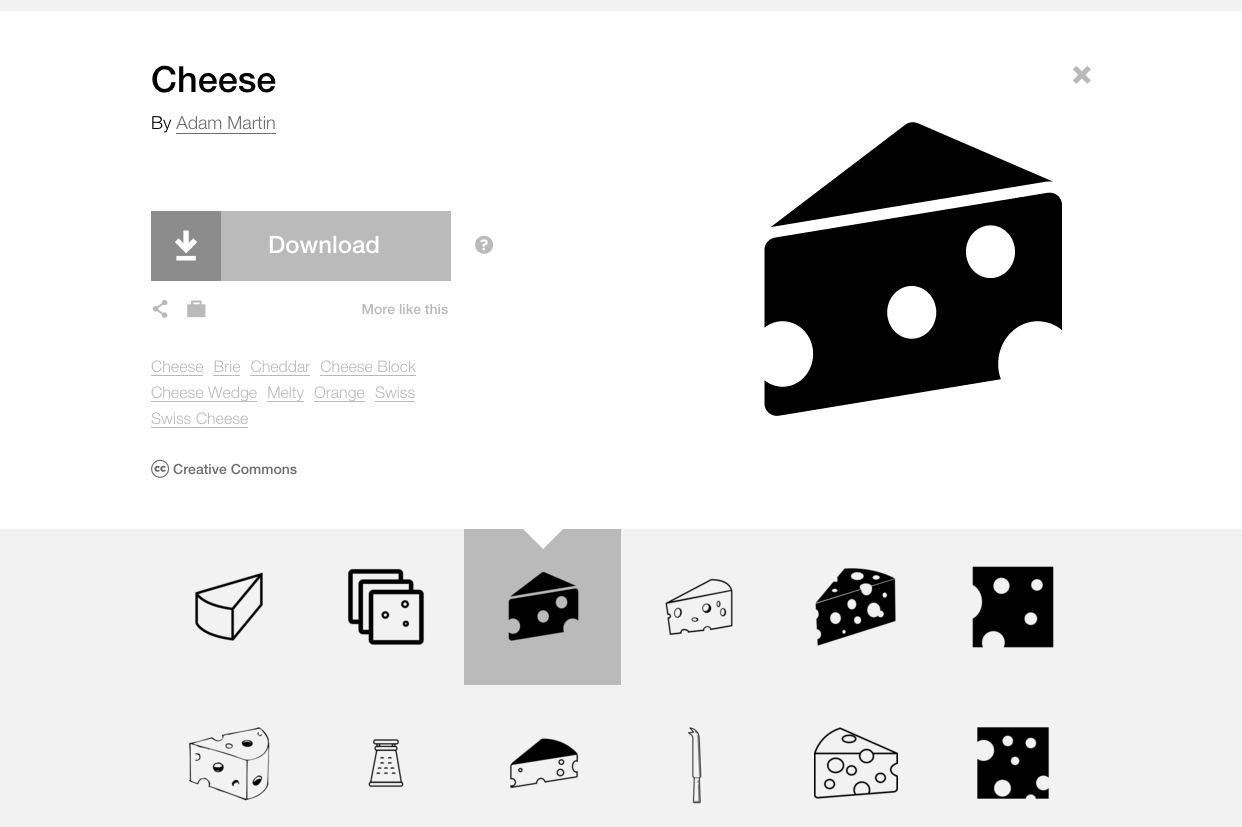
Look for an icon that is mostly black if possible, rather than just an outline. Follow the instructions to download the icon file as an SVG file and add it to your project folder. (You may be prompted to create an account.) Choose the no-cost “Basic Download” option and copy the attribution information that is provided. Most Noun Project icons are licensed under Creative Commons, and are free to use with attribution.
If you want to adapt an icon or create your own icon instead, you’re welcome to do that.
2. Create a new Illustrator document that is 8.5 inches wide by 5.5 inches tall. (This is like folding a standard piece of printer paper in half.) Make sure the units are set to inches! Save the .ai file into your project folder.
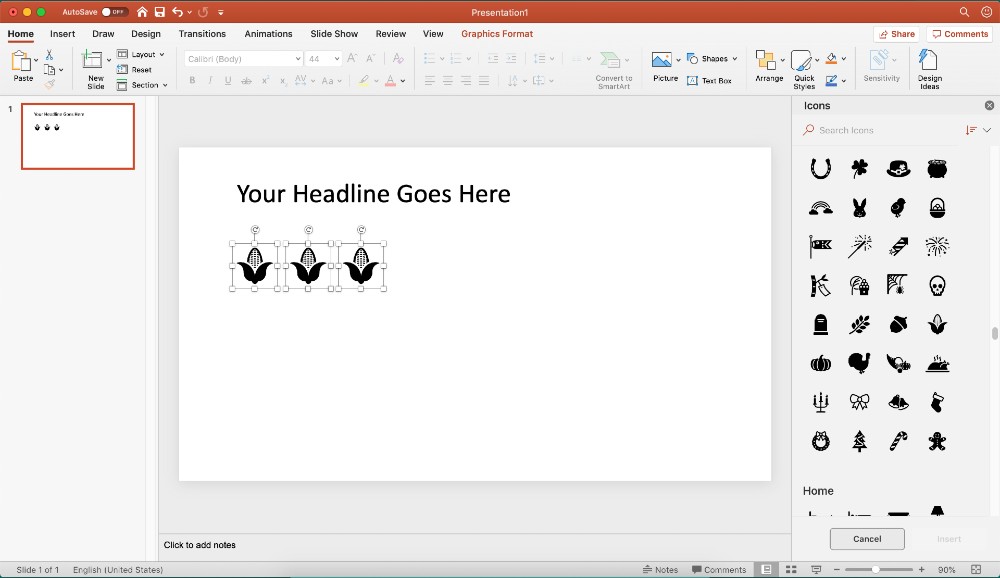
3. Bring your icon into your Illustrator document. There are multiple ways to do this, but one option is going to File > Place and navigating to the SVG file.
The icon is usually grouped by default. Select it and go to Object > Ungroup. There is usually a tiny bit of text for the attribution, which you’ll need later to give credit, but for now you can drag it off somewhere out of the way.
4. Change the size of your icon by selecting it with the black arrow tool and holding Shift while dragging one of the corners. Make it small-ish, then copy and paste until you have the correct number of icons for your first year. Next, copy-paste enough icons for the second year and make them a different color for now.
5. Move your icons into an orderly arrangement showing the first year and then the second year. Here are some tools and tips for accomplishing this:
- Hold Shift: If you hold Shift when you drag things around, it will lock them into moving in straight lines.
- Alignment Tools: Highlight what you want to even up, then go to Window > Align to bring up the palette of align and distribute buttons. Here’s a video tutorial on how those work: https://youtu.be/Atdi5ktHVas
- Selection Tools: There are shortcuts to selecting similar objects on your artboard if you go to Select > Same and choose what makes them similar, such as color. Here’s a video tutorial on the most useful selection options: https://youtu.be/ykWf21z84WM
6. Now write a sentence summarizing the chart, which we’ll use to help readers understand what they’re seeing. It’s recommended that you follow this format:
“In _____[year], Americans’ per capita consumption of _____[food product] was _____[amount and unit of measurement]. By _____[year], consumption _____[increased/decreased/doubled/etc.] to _____[amount and unit].
7. Now we need to add text labels to the chart. Make sure to add:
- A short but descriptive headline at the top, in size 18pt text or larger. Be more descriptive than just “Cheese Consumption.” Either tell us more about it (“Cheese Consumption Triples”) or be intriguing/entertaining (“Americans Say Cheese”).
- Your descriptive paragraph from Step 6 under the headline in a smaller size, like 12pt or so.
- Your sources credited at the very bottom in a small size, like 9-11pt text. Mention both the data source (“Source: USDA Food Availability Data System”) and the attribution for your Noun Project icon (“Icon by Firstname Lastname”). If you created the icon yourself, give yourself credit.
8. Finally, we need to add a key so readers know how much each icon represents. Refer back to your spreadsheet to make sure you get the number correct. In the cheese example, 1 icon is equal to 1 pound of cheese. But in other instances, 1 icon may be equal to 5 gallons or 10 ounces or whatever applies with your data.
• Option 1: Create a key somewhere on your document separate from your chart
• Option 2: Use text on your chart to indicate how much one icon represents
9. When everything about your chart looks great, go to File > Save As and save a finished PDF version into your project folder. Make sure to consider good charting practices for color and font choices, readability and accuracy.
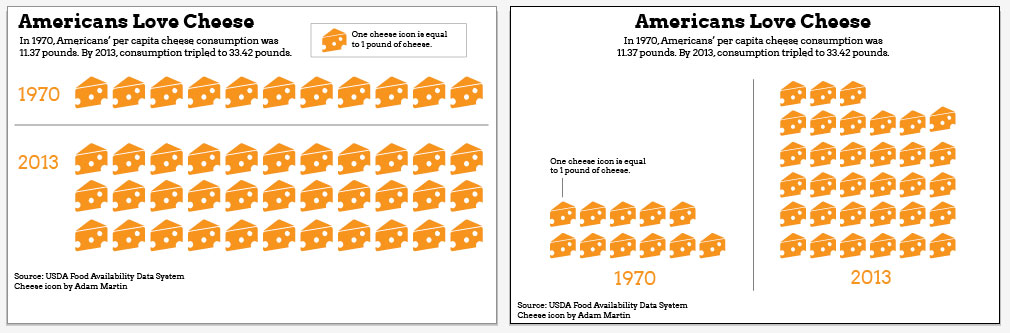
Two possible arrangements with all required text labels.
Written Questions
Answer the following questions in 1-2 sentences each:
1. The ERS data is for food availability rather than measuring actual consumption, so it’s just an estimate. How accurate do you think it seems for your selected food product? Is it more or less than you would have expected for that product?
2. For your selected food product, does the pictogram do a good job showing the overall trend? (It may be helpful to make a quick chart of all the years to see the trend.)
3. What is a different chart type that might be interesting for displaying this data, and why?
Submitting Your Work
Complete your assignment by submitting the following materials to Blackboard:
- Your data spreadsheet showing icon calculations
- Your pictogram chart (PDF)
- Word document with written responses