
Certain types of tree diagrams, such as tree maps and Sankey diagrams, make use of numerical data. But tree diagrams are also useful for qualitative data that can’t be visualized with many other chart types. Flowcharts and network diagrams are particularly good at showing processes and relationships.
In this assignment, you’ll create a flowchart that offers advice for different scenarios. This is a more open-ended and creative project to take a break from the step-by-step tutorials.
1. First, think of a topic where you can offer advice.
- It may help to think about topics like advice for WSU freshmen, advice for people visiting your town for the first time, advice about which streaming show to binge, etc. This is a good opportunity to choose a topic related to a job, internship or career goal if you want.
- There should be at least several different options or steps, but keep it pretty focused so your flowchart doesn’t become overly complicated.
- The tone is up to you — this can be humorous or serious, sincere or more tongue-in-cheek… whatever fits your idea and personal style.
2. Sketch out the flowchart. It usually takes a few tries to get it the way you want. You can think of this as a rough draft, so it doesn’t have to be perfect, but also think about whether you can make use of an visual encoding like using color, shape or size to represent different attributes in your information. Save your sketch to submit later.
3. Make a version of your flowchart using either Adobe Illustrator or the free online software at diagrams.net. You can also opt to try the free version of Lucidchart if you want, since this is a popular tool in project management.
For Adobe Illustrator:
- Create a new document using one of the standard web presets, such as Common or Web-Large.
- Make your flowchart with at least 10 different steps or options (often called “nodes” in tree diagrams). If your sketch was more complicated than that, it’s fine to simplify it.
- Use shape and line tools to create boxes, arrows and various shapes. The flowchart should be made of geometric shapes, not hand-drawn with the brush or pencil tool. (If you like sketching, the “Shaper” tool is a good option.)
- Use options from the Properties tab on the right to change colors, border, line thicknesses and other aspects of your shapes. Use a consistent visual style.
- When you’re done, go to File > Export As > PNG or JPEG, and save it to your device.
For diagrams.net (formerly Draw.io):
- Watch this quick introduction video (especially useful for showing the connection options.)
- Explore the software to see your different options with shapes, arrows, text, color, etc. Note the “Arrange” tab that appears on the far right side if you need to move overlapping things in front or behind each other.
- Make your flowchart with at least 10 different steps or options (often called “nodes” in tree diagrams). If your sketch was more complicated than that, it’s fine to simplify it.
- Think about use of color, shape and hierarchy. You can try as many options as you want, but end up with a consistent visual style.
- When you’re done, go to File > Export as > JPEG, change the percentage to 300% for a higher-quality image, and save it to your device.
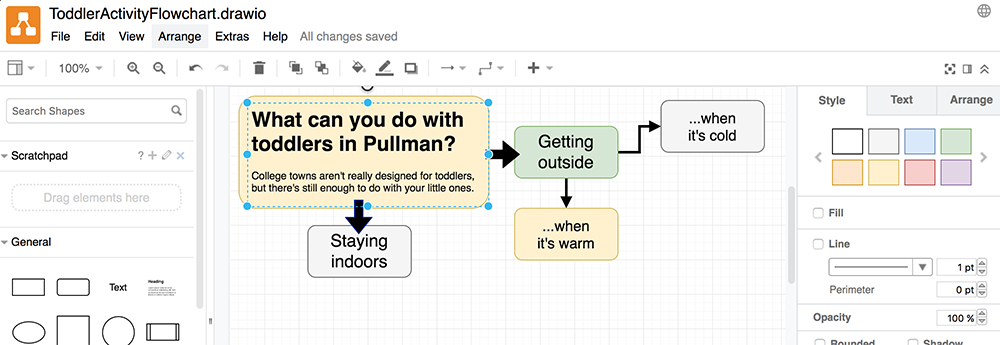
Here’s what a diagrams.net (formerly Draw.io) chart looks like in progress. This is not a Google product, but the interface is intentionally similar to Google apps.
Submit the Assignment
Complete the assignment by submitting the following materials to the corresponding assignment dropbox in Blackboard:
- Photo or scan of your drawn/sketched flowchart
- Exported JPG or PNG from diagrams.net or Illustrator