In this assignment, you will curate a list of people or groups that produce visual work that you find inspiring or influential, and design your list as a visually appealing infographic.
Visual Inspiration List
Create a list of 4-5 people or groups to follow for visual inspiration on a particular topic/theme. This is a chance to share your expertise on a topic that is meaningful to you. Think beyond photography to visual elements such as typography, illustration, graphic design, color and overall style.
You can choose any topic or theme, but it helps to be specific and must be connected to visuals in some way. This can be an opportunity to share what you know, such as favorite tattoo artists or fashion photographers, or it can be an opportunity to learn about a topic related to your personal or career interests, such as top NBA photojournalists or illustrators who’ve had their work featured on Starbucks merchandise.
All the people or groups on your list should be regularly sharing work on at least one platform, such as social media or their own website. The work doesn’t all need to be new, but there should be regular updates — for instance, there are some museums that share old works of art that are related to current events in some way.
For each of the four or five, write or collect this information:
- Who: Name of person/group/brand
- What: Describe their work overall (1-2 sentences)
- Where: What platforms are they active on? How do you recommend following them? (Include at least one link)
- Why: What makes them notable or interesting? Why do you recommend? (2-3 sentences)
- At least one image to show a representative example of their work
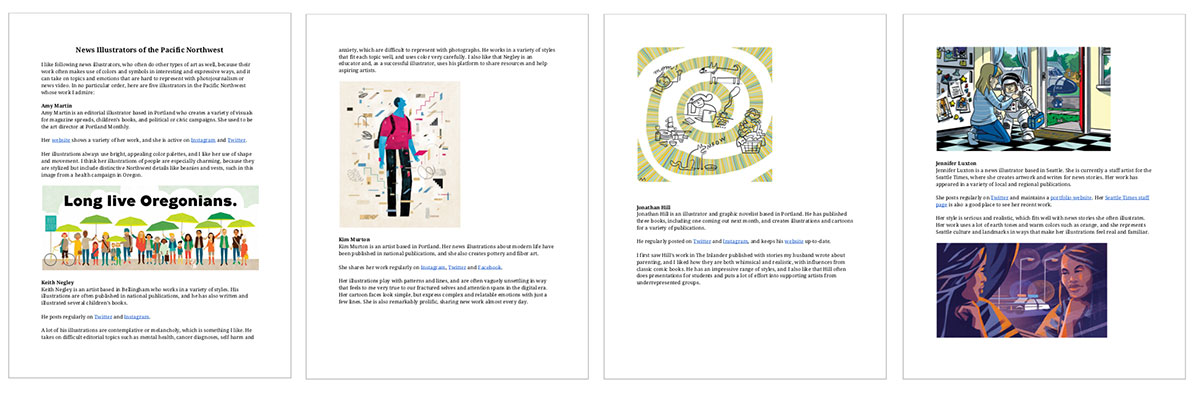
Here’s a complete example: News Illustrators of the Pacific Northwest
Making an Infographic
Adapt your full visual inspiration list into a visually appealing infographic. This portion gives you creative flexibility to create an infographic with software tools of your choice. An infographic is a generic term for an image that presents information in a visually rich way through a combination of text and visual elements.
Your infographic should:
- Include your topic or theme of your list as a title.
- Include the most essential information about each of your 4-5 examples. Summarize the full text you wrote earlier, including the name and a description of 1-2 sentences. There should be enough information to explain to viewers why you put this example on your list.
- Include a visual for each example, such as the image you selected earlier or a meaningful visual icon.
- Be saved at the end as a single image in JPG, PNG or PDF file format.
There are many different tools you can use to create your infographic. Later in this semester we will go over typography, layout, color schemes and other elements useful for creating visuals, but this exercise is just about experimenting and beginning to think about those design choices.
You can create your infographic from scratch, or you can use a template and customize it with your content. Some options include Adobe Illustrator (from scratch or with Adobe Stock templates), Adobe Express, Canva, Venngage, Visme or others. Many of these sites require that you sign up for a free account and frequently change which features are available in the free version, so it’s a good idea to check that before you do too much work.
If you have done this sort of project frequently in other classes or internships, challenge yourself to try out a new tool or build a custom infographic in Illustrator or InDesign.

Examples of infographic templates that might work as a starting point because they include a title, descriptions and visuals for each example.
Submitting Your Work
Submit the following to Canvas by going to “Assignments” and uploading the files with your submission:
- Word document with full text and images
- Completed infographic in a JPG, PNG or PDF file format
Demonstrated Skills:
- Follow instructions for organizing creative and original insights into a standard format
- Successfully communicate personal expertise on a visual topic
- Write both thorough descriptions and summaries of the same information
- Assess and use infographic tools to create a completed file suitable for publishing